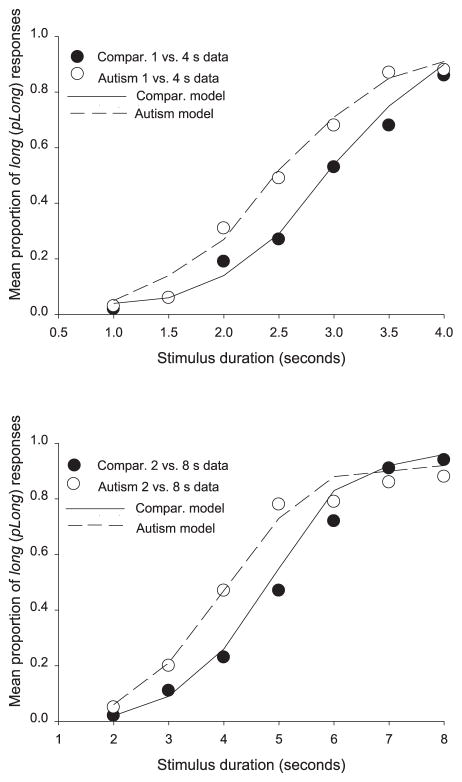
Figure 1.
Data points (empty and filled circles) and best fitting values from the model described in the text (dashed and solid lines) from participants with and without autism (respectively), in both versions of the task (upper panel: 1 vs. 4 s discrimination; lower panel: 2 vs. 8 s discrimination). Compar. = comparison group.

