
Fig. 3.
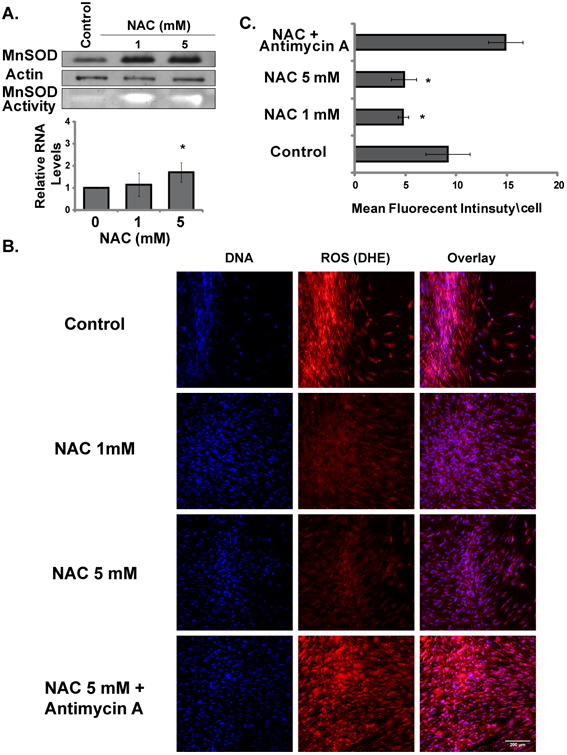
NAC induces MnSOD expression and activity and suppresses ROS levels in quiescent cells. A. MnSOD protein, activity and mRNA levels in control and NAC treated quiescent cells after 15 days. B. Representative confocal microscopy images of control and NAC treated quiescent cells at day 3 after wounding labeled with DHE for ROS levels. C. DHE mean fluorescent intensity in control and NAC treated quiescent cells normalized to total cells in the field of measurement. Values are means with their standard deviations (N=3). Asterisk indicates significant difference between control and NAC treated cells (P < 0.05).