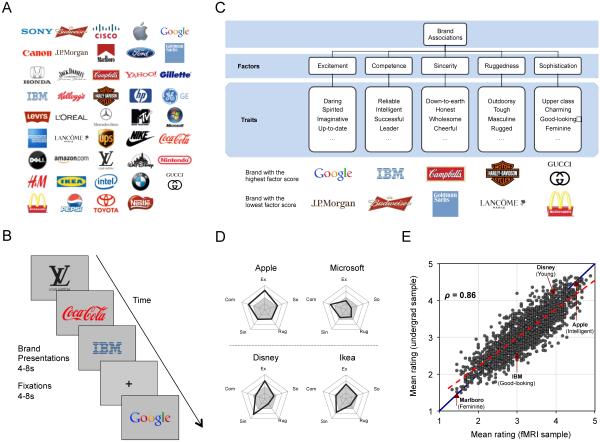
FIGURE 1. Experimental Paradigm And Behavioral Results.
(A) A total of 44 brands and their associated logos were used in the experiment, chosen from Interbrand’s list of top global brands. (B) Subjects engaged in a passive viewing task, and were instructed to think about the characteristics or traits associated with each brand. For each trial, a brand logo was presented for 4-8 seconds on a gray background. (C) Quantitative description of brand association was derived using the Aaker brand association framework. For each brand, participant rated a set of 42 traits (e.g., down-to-earth), yielding a set of five latent features via factor analysis. Examples of the extreme brands are presented at bottom to illustrate how brand associations were captured in this framework. (D) Radar chart of example brands that reside in the same industry but possess distinct associations (Apple and Microsoft), and those in different industries but possess similar associations (Disney and Ikea). Each vertex indicates a brand personality factor (Ex: Excitement, Com: Competence, Sin: Sincerity, Rug: Ruggedness, So: Sophistication). Vertex the factor score of brand on each dimension. Shaded (unshaded) regions indicate negative (positive) factor scores. (E) Mean trait rating of neuroimaging experiment participants were highly correlated with those from an independent pool of undergraduate students (Pearson r=0.86,p<10−10).

