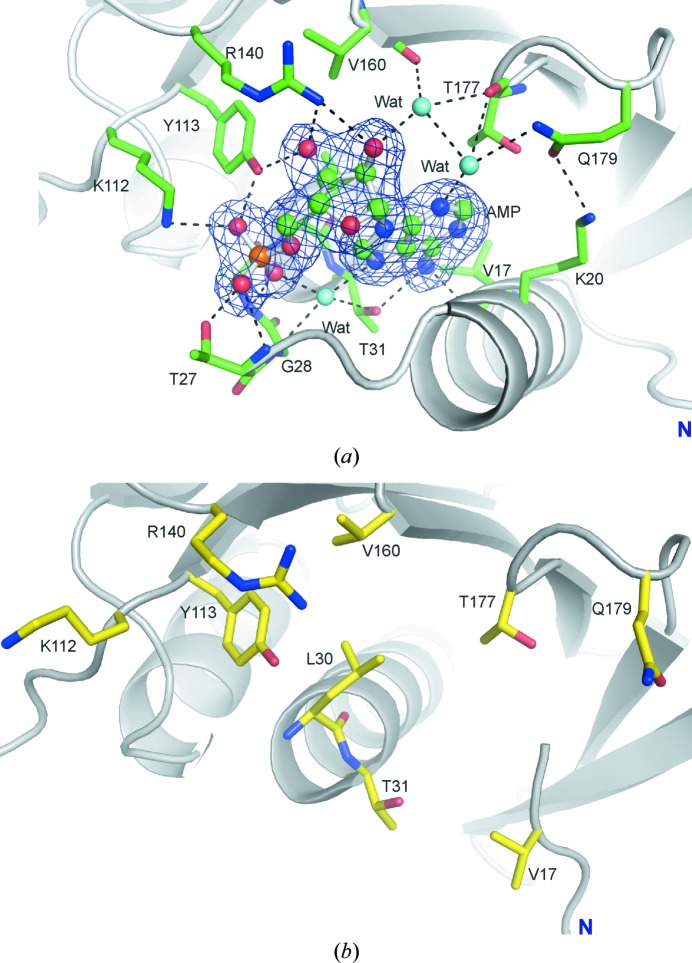
Figure 3.
(a) The AMP-binding site of human muscle FBPase in the T state. The AMP molecule is shown in ball-and-stick representation. The F o − F c OMIT electron-density map (blue mesh) is contoured at the 4σ level. Hydrogen bonds are shown as dashed lines. (b) The AMP-binding site area in the R state, where no AMP is bound.

