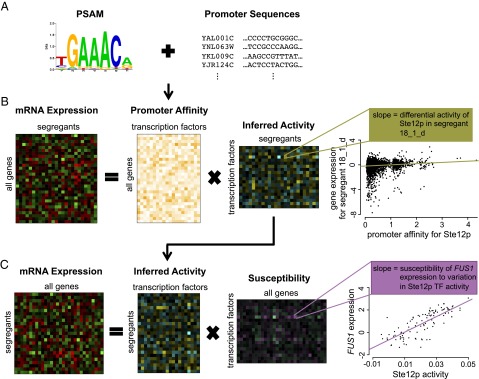
Fig. 2.
Method for inferring TF activities and regulatory susceptibilities. (A) We use binding preferences in the form of a PSAM for 123 yeast TFs as prior information to calculate aggregated affinity scores on the promoter region for every gene. (B) TF activities are inferred by performing regression of the genome-wide expression data for each segregant on the aggregated affinity scores (11). The affinity matrix is unique for each segregant and depends on the genotype. The expression data contains differential mRNA expression (log2) ratios relative to a pool of parental strains. The slope in the scatter plot reflects the inferred (differential) protein activity level. Here each point represents a different gene. The x axis represents promoter affinity for the transcription factor Ste12p, and the y axis represents differential expression in segregant 18_1_d. (C) We estimate gene-specific susceptibilities by regressing their mRNA expression level on TF activities across segregants. In this case, the slope in the scatter plot corresponds to the susceptibility of the expression of FUS1 to variation in Ste12p activity. Each point now represents a different segregant. Note that the in vitro promoter affinity score of a gene is calculated based on the underlying genomic sequence. The in vivo susceptibility, by contrast, contains functional regulatory information and is based on the gene’s mRNA expression profile across segregants.

