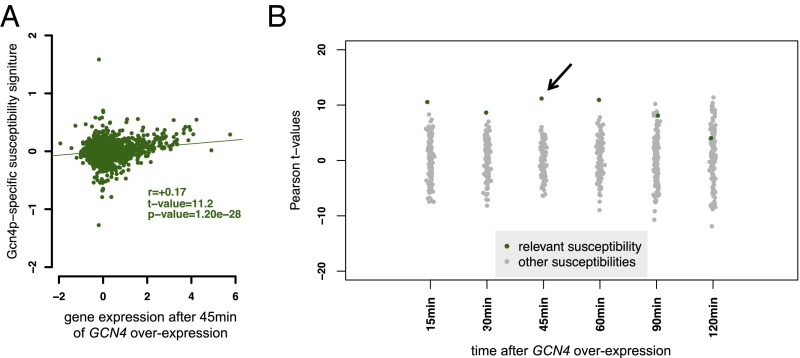
Fig. 4.
Validation of susceptibility signature of Gcn4p. (A) Scatterplot of the susceptibility signature for Gcn4p vs. the genome-wide response to GCN4 overexpression after 45-min induction. (B) Correlation across a time series of GCN4 overexpression data. Each point represents the correlation of transcript abundance with the susceptibility signature of each of the 123 TFs. Here the black arrow indicates the t value of correlation displayed in A. See Fig. S4 for a similar plot for Ste12p.

