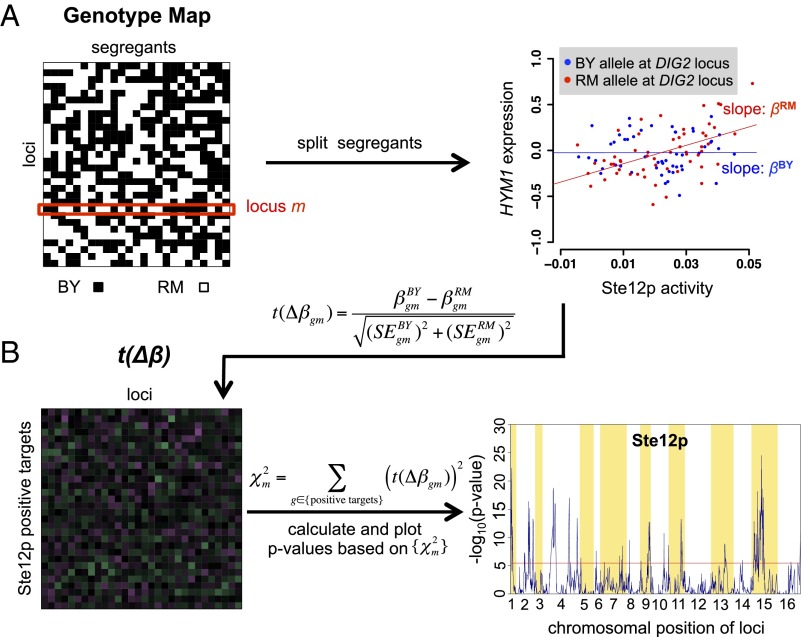
Fig. 5.
Overview of our method for identifying cQTLs. (A) For each TF, we calculate allele-specific susceptibility by first splitting the segregants based on the parental allele (BY or RM) inherited at locus m. Next, susceptibilities, βBY and βRM, are obtained for each segregant subset independently by performing univariate regression of the differential mRNA abundance of each gene, g, on the activity of each TF. mRNA abundance is measured relative to a mixed pool derived from the parental strains (6). The scatterplot shows how HYM1 mRNA abundance (y axis) responds to Ste12p activity (x axis) and how this responsiveness differs between segregants that have inherited the BY and RM allele, respectively, at the DIG2 locus. To avoid circularity, Ste12 activity was inferred using all genes except HYM1. (B) Using allele-specific susceptibility data, we construct a matrix in which each element contains a t statistic corresponding to the susceptibility difference between βBY and βRM for each gene/locus combination. The last step involves calculating a χ2 statistic for each locus by summing the squared t values for all positive targets of Ste12p and converting it to a P value based on the standard null distribution of the χ2 distribution (the larger χ2, the smaller the P value). Loci that reach statistical significance after correcting for multiple testing (red line) are classified as cQTLs.

