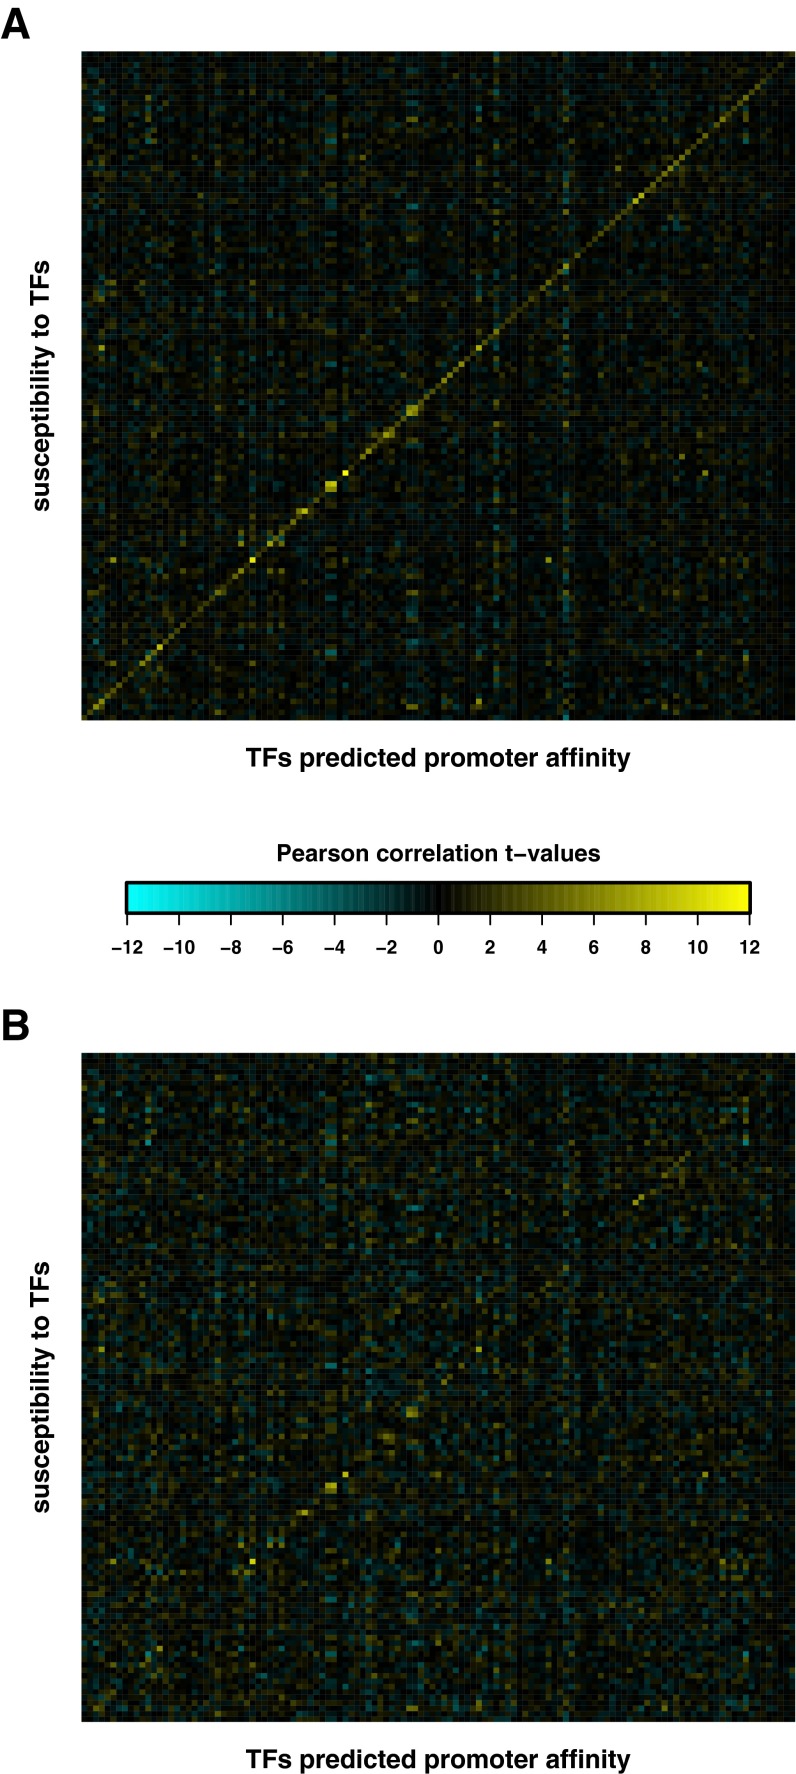
Fig. S1.
Resolving the circularity problem for susceptibility calculation. The heat maps summarize t values of the Pearson correlation between the susceptibility signatures and promoter affinity profiles for each of the 123 different TFs. For each segregant, first the differential TF activities were obtained by applying multiple regression of differential mRNA abundance of (A) all genes and (B) all genes but leaving out one gene (g) at a time on the TF affinity score profiles. Next, the susceptibilities of each gene (g) were obtained by applying multiple regression of the differential mRNA abundance of g on the TF activities from A and B, separately. In B the TFs with significant t values on the diagonal correspond to the 12 TFs that pass the TF selection step for multiple regression (Results and Materials and Methods).

