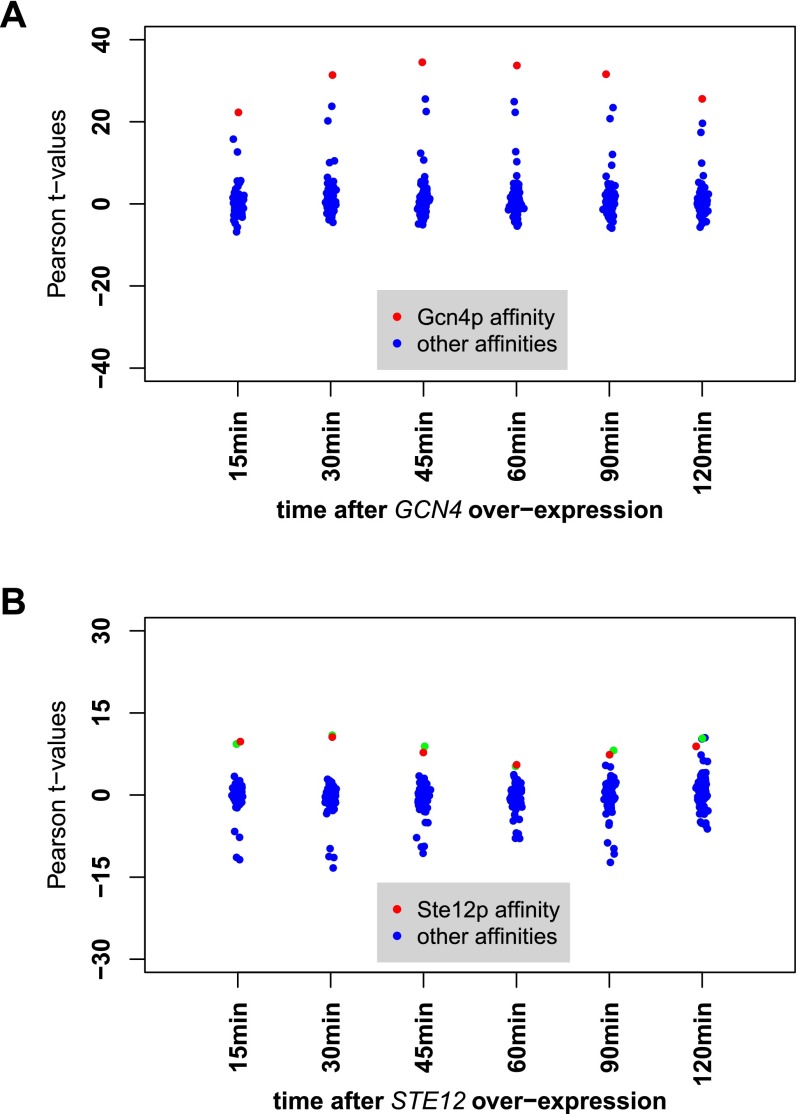
Fig. S3.
Correlation between expression response after overexpression of GCN4 and STE12 and promoter affinity. The x axes represent the overexpression data at different time points. Each point corresponds to the Pearson t value of the correlation between the affinity profile of a particular TF and the genome-wide differential mRNA abundance for the overexpression of GCN4 (A) and STE12 (B). The t values of the correlation between the affinity profile to Gcn4p, and Ste12p are indicated in red in each relevant panel. Affinity profiles of these two TFs are exclusively correlated with the overexpression data. The green dots in B correspond to Dig1p, a known cofactor of Ste12p (21). These results demonstrate that the in vitro occupancies correlate significantly to the in vivo function of Gcn4p and Ste12p.

