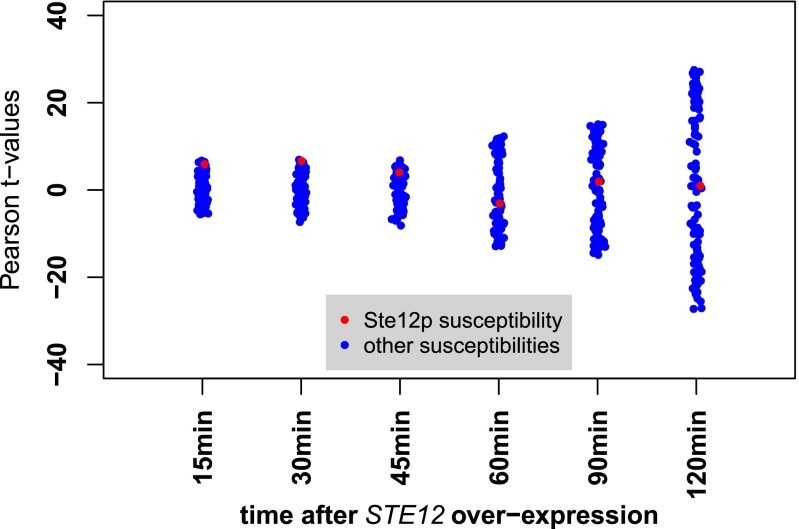
Fig. S4.
Correlation between expression response to STE12 overexpression and regulatory susceptibility. The x axis represents the overexpression data at different time points. Each point corresponds to the Pearson t value of the correlation between the susceptibility signature for a particular TF and the differential mRNA abundance in the overexpression experiment. The t values of the correlation to susceptibility signature for Ste12p are indicated in red in each time point column. For Ste12p, the correlation is not significant from the 30-min time point onwards (Results).

