Fig. 2.
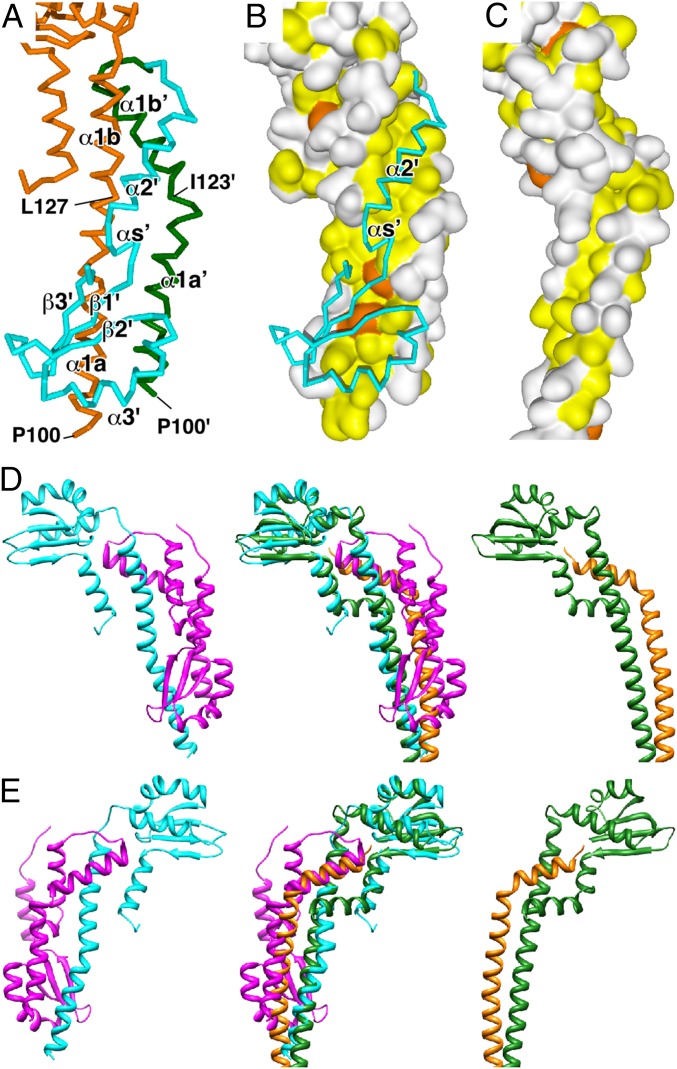
Structure of the FliHC homodimer compared with the peripheral stalk complex of A/V-type ATPases. (A) Cα backbone trace of the dimer interface. FliHC-A is shown in orange. α1′a and α1′b′ (′ denotes FliHC-B) of FliHC-B are colored in green, and the other parts of FliHC-B are in cyan. α4 of FliHC-B is removed for better visualization. (B) The hydrophobic surface produced by α1a, α1b, α1a′, and α1b′. The molecular surfaces composed of FliHC-A and α1a′ and α1b′ of FliHC-B are shown with the Cα backbone trace of α2′, αs′, and the following globular domain of FliHC-B. The surfaces of the aromatic and other hydrophobic residues are painted orange and yellow, respectively, and those of the other residues are white. (C) Surface representation of the E–G complex of A-ATPase from T. thermophilus (PDB ID code 3V6I) with the same color coding as B. (D) Ribbon diagrams of the FliHC homodimer and the E–G complex of A-ATPase from T. thermophilus (PDB ID code 3V6I) (Left and Right, respectively). (Middle) Superposition of the two complexes. FliHC-A is shown in cyan, FliHC-B in magenta, the E subunit in green, and the G subunit in orange. (E) View from the back side of D.

