Fig. 4.
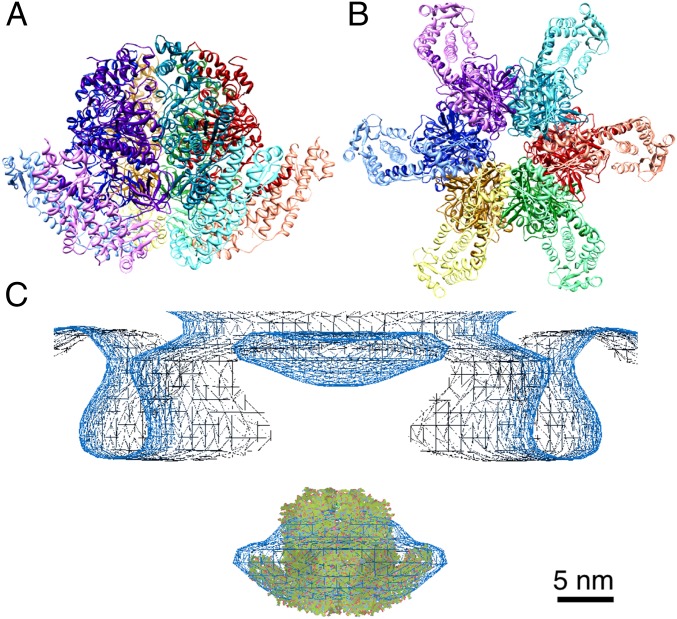
Hexameric ring model of the FliHC2–FliI complex. (A) Ribbon diagram of the ring model. Each FliHC2–FliI trimer is shown in a different hue. FliHC2 and FliI in each trimer are indicated in light and dark colors, respectively. (B) View from the bottom of A. (C) The ring model fitted into the globular density below the flagellar basal body obtained by electron cryotomography (35).

