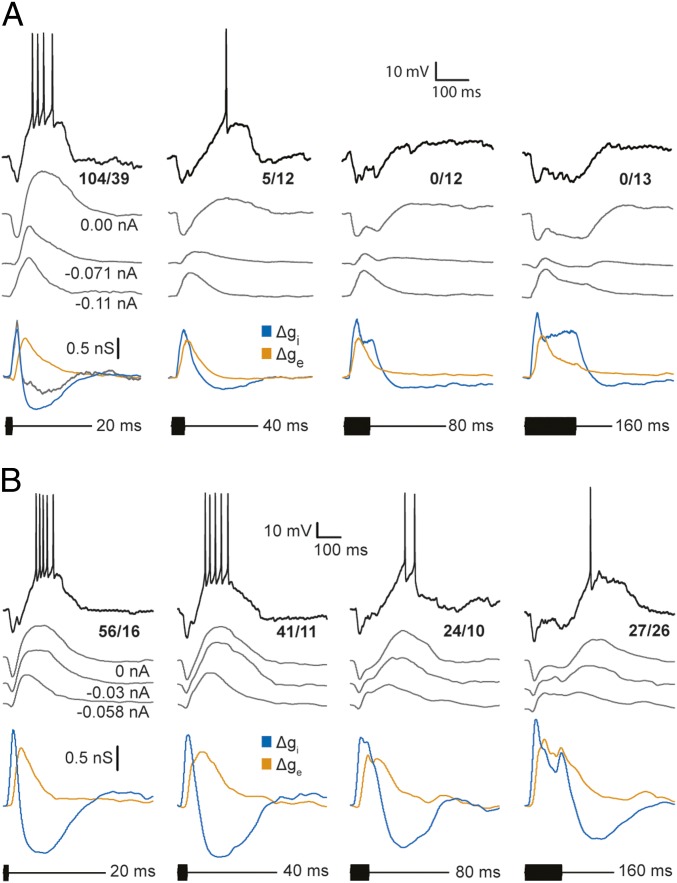
Fig. 4.
Sharpness of duration tuning depends on the overlap of excitatory and inhibitory conductance changes in response to long-duration sounds. Whole-cell recordings and profiles of excitatory and inhibitory conductances for strongly selective (A) and weakly selective (B) short-pass neurons. Representative membrane potential responses to a single stimulus presentation (black) and averaged responses (gray traces) are shown; the number of spikes elicited over the number of stimulus repetitions is displayed for averaged responses (0 nA current clamp condition). Gray traces show averaged responses (spikes removed), recorded at the levels of current clamp indicated, used for reconstructing (estimating) the time courses of excitatory (orange) and inhibitory (blue) conductance changes. (A) The time course of inhibitory conductance for 20-ms tone bursts also was estimated using only the recordings at negative current clamp levels (gray trace). Resting potential = −65 mV; stimulus amplitude = 63 dB SPL; carrier frequency = 240 Hz (BEF of the neuron). (B) Resting potential = −74.5 mV; stimulus amplitude = 63 dB SPL; carrier frequency = 730 Hz (BEF of the neuron).

