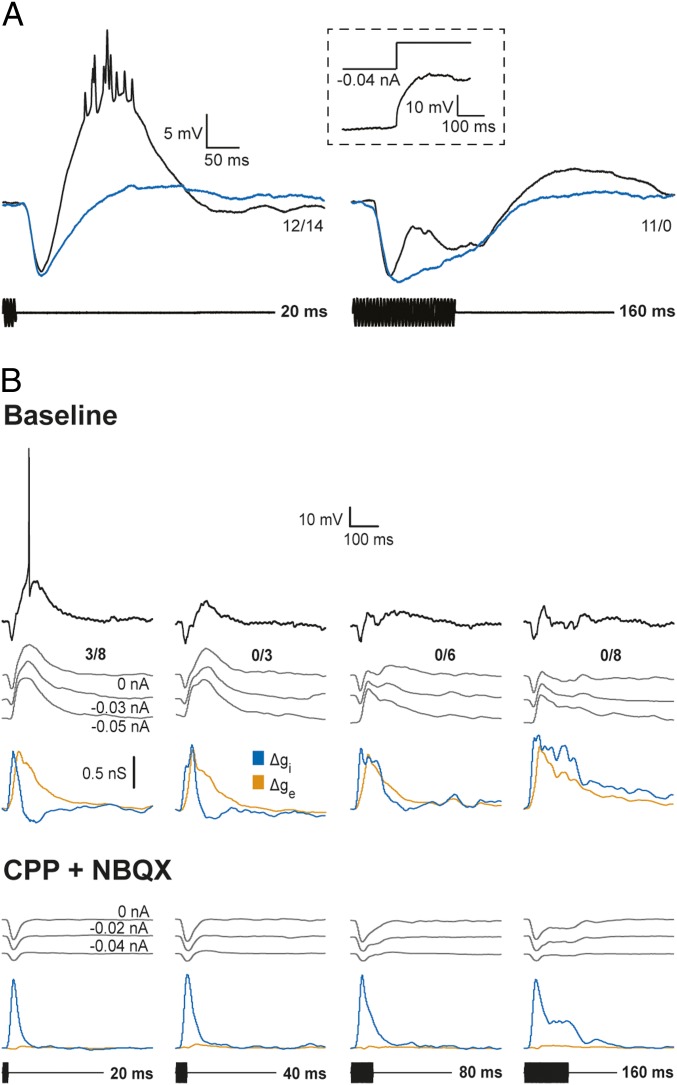
Fig. 8.
Postinhibitory rebound was not observed. (A) Whole-cell recordings of responses to tone bursts of 190 Hz (black), the BEF of the neuron or 330 Hz (blue), which primarily elicited inhibition. (Inset) Response to release from −0.04-nA current injection. Resting potential = −82.2 mV; stimulus amplitude = 57 dB SPL. (B) Responses of a short-pass neuron before and after ∼8 min iontophoresis of NBQX (5 mM, +70 nA) and CPP (10 mM, +50 nA) to block AMPA- and NMDA-type glutamate receptors, respectively. Voltage recordings of responses to tone bursts (carrier frequency = 470 Hz) of various durations were made at the current clamp levels shown; estimates of changes in excitatory (orange) and inhibitory (blue) conductances are based on, and shown below, each set of these recordings. The number of spikes elicited over the number of repetitions is shown at the right end of each response (0-nA current clamp). Resting potential = −70.5 mV and −74 mV before and after blocking excitation, respectively; stimulus amplitude = 62 dB SPL.

