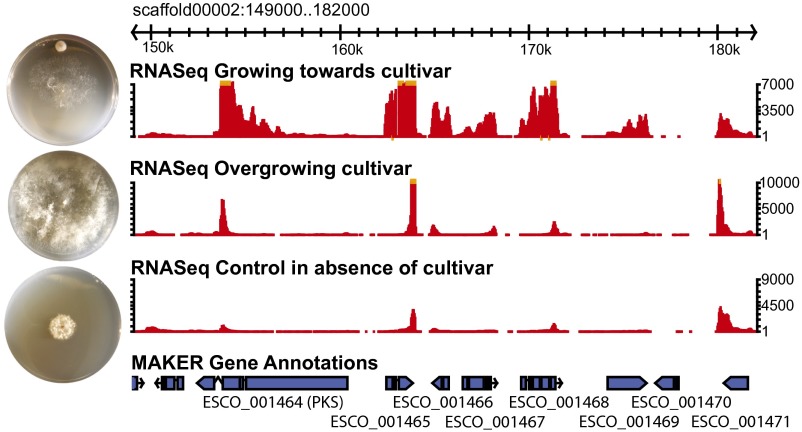
Fig. 4.
Up-regulation of gene expression within a secondary metabolite cluster during interaction with cultivated host fungi. Gbrowse genome browser view of 1 of 16 secondary metabolite clusters in the E. weberi genome. Below the scaffold are three tracks illustrating RNAseq-based gene expression when E. weberi is growing toward its host (Top), when it has overgrown its host (Middle), and in the absence of its host (Bottom); MAKER2 gene model predictions are illustrated below. Photographs next to each RNAseq track illustrate the growth of E. weberi under each condition. Each Petri dish was inoculated with the cultivated fungus near the top (when present) and E. weberi near the center 1 wk later; photographs were taken 3–4 d after E. weberi inoculation. Note that E. weberi grows much more rapidly in the presence than in the absence of its host. See SI Appendix, Fig. S1 for additional images.

