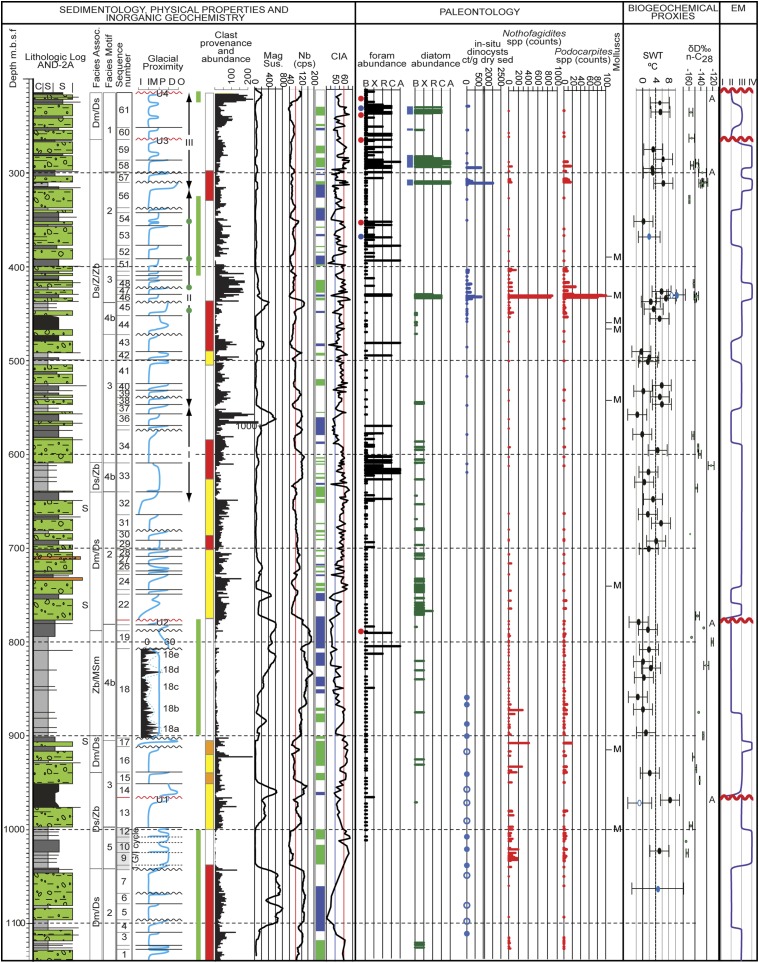
Fig. S3.
Stratigraphic and chronologic summary of the lower 925 m of the AND-2A core showing 61 sedimentary cycles of ice sheet margin advance, retreat and readvance before, during, and immediately following the MCO. Lithologies (rock types) are plotted against depth; s, shear fabric and inferred glacial overriding. Facies associations are after ref. 26 and stratigraphic motifs and sequences are defined by ref. 2. A glacial proximity curve tracks the relative position of the grounding line through ice-contact (I), ice-marginal (IM), ice-proximal (P), ice-distal (D), and open marine (O) environments. Heavy mineral assemblage intervals (I–III) are from ref. 58, and green circles indicate horizons with kyanite likely derived from the Nimrod Glacier catchment. Clast provenance indicates the relative influence of ice flowing from the Royal Society Range west/southwest of the drill site (red), the Skelton and Mulock glacier catchments (yellow), and Carlyon and Byrd glacier catchments (orange). Clast abundance is plotted in 1-m interval bins. Foram abundance data from ref. 30. Inferred cold water/ice marginal assemblages (Ehrenbergina) are indicated by red circles and occurrences of cool water planktonic species by green (Globorotalia spp.) and blue (Neogloboquadrina pachyderma) circles. Diatom abundance data after ref. 23. Blue bars indicate presence of sea ice species. Palynomorph data include in situ dinocyst and Nothafagidites counts per gram of dry sediment down to 650 mbsf (32) and whole counts of Podocarpacea to the base of the core. Intervals containing well-preserved molluscs reported in ref. 29 are indicated with an M. Organic lipid biomarkers include TEX86 from Thaumarcheota. Low temperature TEX86L calibration (63) was used to calculate SWT estimates (red line). CIA provides an indication of arid (<52, blue) and less arid (>58, green) conditions.

