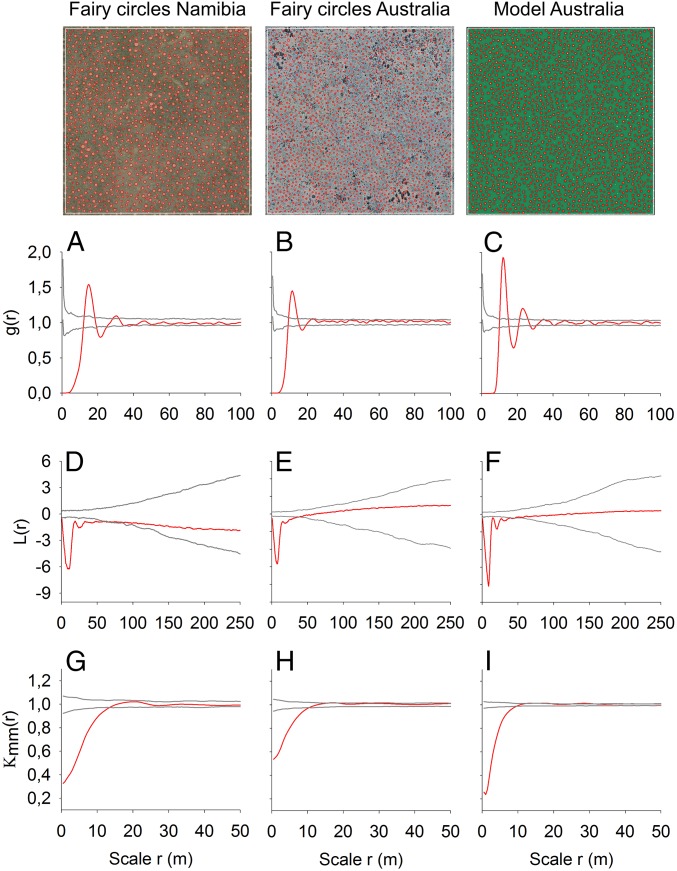
Fig. 3.
Spatial pattern analysis of fairy circles. The spatial structure of the Namibian FCs (A, D, and G) agrees in all main characteristics with the Australian FCs (B, E, and H). In addition, the spatial structure of the modeled FCs (C, F, and I) based on vegetation self-organization agrees with the observed gap pattern in Australia. The size of the aerial images and the modeled map is 500 × 500 m. The spatial patterns were contrasted to null models using the pair-correlation function (A–C), L-function (D–F), and mark-correlation function (G–I). Patterns are regular and aggregated at circular neighborhood scales r if the red line of g(r) or L(r) is below the lower and above the upper gray lines of the simulation envelopes, respectively. Circle areas are negatively and positively correlated if the red line of kmm(r) is below and above the simulation envelopes, respectively. The parameter values used in the modeled FCs are given in SI Appendix, Table S4, with P = 330 kg/(m2⋅y) (or equivalently 330 mm/y).

