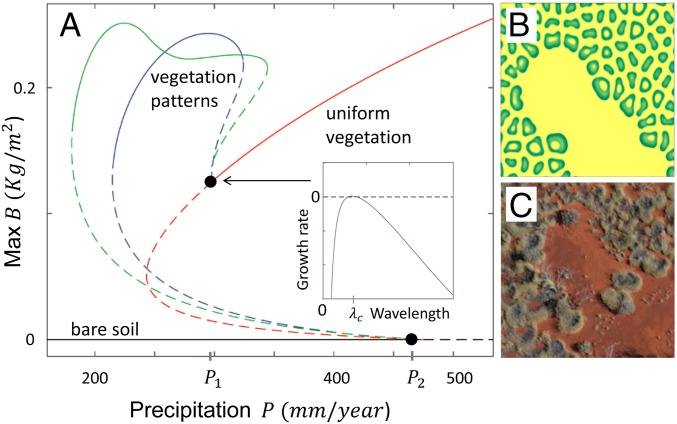
Fig. 4.
Bifurcation diagram and related patterns. The diagram (A) shows stationary 1D solutions of SI Appendix, Eq. 1, describing uniform bare soil (black), uniform vegetation (red), and two periodic vegetation patterns (blue and green). Solid (dashed) lines represent stable (unstable) solutions. The vertical axis shows the biomass density of the uniform solutions or its maximal value for periodic solutions. (Inset) The growth rate of small sinusoidal perturbations as a function of their wavelength at P slightly below P1. The growth of a sinusoidal perturbation of finite wavelength λc indicates a nonuniform instability of the uniform-vegetation solution that leads to a periodic pattern with wavelength λc (blue line). Additional periodic solutions exist; shown is the solution that extends to the highest P value (green line). The bare-soil solution loses stability as P exceeds the threshold P2 given by SI Appendix, Eq. 3. Its wide stability range overlaps with those of uniform and patterned vegetation and allows for long-lived mixtures of large bare-soil patches and vegetation patches, as the model simulation in B shows. An analogous field pattern is shown in C. Parameter values for B are given in SI Appendix, Table S4, with P = 280 kg/(m2⋅y) (or 280 mm/y).

