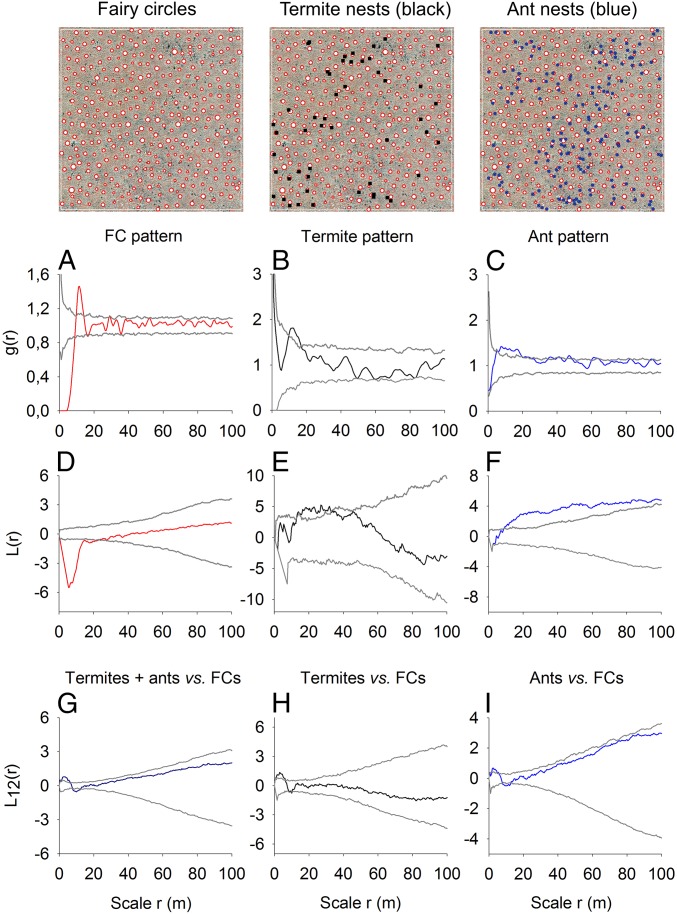
Fig. 5.
Comparison of FC patterns with insect-nest distributions. The Australian FCs (n = 328) are typically hexagonally spaced, showing strong small-scale regularity (A and D), and the pair-correlation function g(r) indicates a distinct density peak at the average distance of the six nearest neighbors at r ∼10 m (A). In contrast, the distributions of the 50 termite (black squares) and 162 ant (blue dots) nests are not regularly spaced but aggregated (B and C). Especially the cumulative L-function indicates for these insect-nest distributions aggregated spacing at small and large scales (E and F). For descriptions of functions see Fig. 3. The cross-correlation analysis with the L12-function shows that the composite distribution of insects (termites + ants, dark blue line), the termite (black line), and also the ant (blue line) distributions slightly aggregate around the FCs (G–I).

