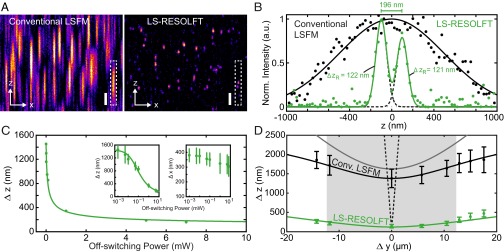
Fig. 2.
Characterization of LS-RESOLFT with spherical HIV-1 particles, in comparison with the conventional LSFM mode. (A) An x-z cross–section through a typical 3D image stack of HIV-1 particles attached to a glass coverslip clearly shows the improvement in z resolution enabled by LS-RESOLFT. Note that pixels correspond to 108.3 nm in x and 25 nm in z, respectively (total image size: 24 × 4 μm2). (Scale bar width and height, 500 nm.) (B) Pixel intensity line profile along the z direction in a marked region in A (white dashed box) for LS-RESOLFT (green dots) in comparison with conventional LSFM (black dots), with single (black line) and double (green line) Gaussian fits to the data. The FWHMs of single Gaussian fits (dashed black line) to the LS-RESOLFT data are far below the (axial) diffraction limit. (C) Dependence of the resolving power Δz on the off-switching laser power. For a fixed off-switching time of 30 ms, the average axial FWHMs of HIV-1 particles imaged in LS-RESOLFT mode were determined for various powers of the switch-off light bounding the axial zero-intensity plane. Mean FWHM values are plotted versus off-switching power in the back-focal plane of the illumination objective (green dots). Fit (green line) to the data confirms the inverse scaling with the square root of the applied intensity. The same data and fit are shown on a logarithmic scale (Left Inset), together with error bars derived from the SD of a Gaussian fit to the histograms (Fig. S5). (Right Inset) Lateral (x-y) FWHM dependence on off-switching power is shown (see the text). (D) At several positions along the illumination axis of the LSs, the average axial FWHM of the HIV-1 images were determined. The distance Δy in the measured sample plane from the minimal beam waist position is derived by the method shown in Fig. S6. The average value of Δz together with the SD is plotted versus the measured value of Δy for conventional LSFM (black data points) and LS-RESOLFT (green data points). From a fit to the conventional LSFM data (black line), the experimentally realized (diffraction-limited) illumination profile is inferred (gray line) for an illuminating Gaussian LS and a (near-) Gaussian axial detection profile. The FOV (gray box) of the microscope is then defined by the increase in waist by -fold to both sides. For reference, the FWHM beam waist of a theoretical Gaussian LS with the same minimum value as achieved by RESOLFT is plotted versus Δy (black dashed line). LS-RESOLFT substantially extends the available FOV along the y direction.

