. 2016 Mar 16;113(13):3442–3446. doi: 10.1073/pnas.1522292113

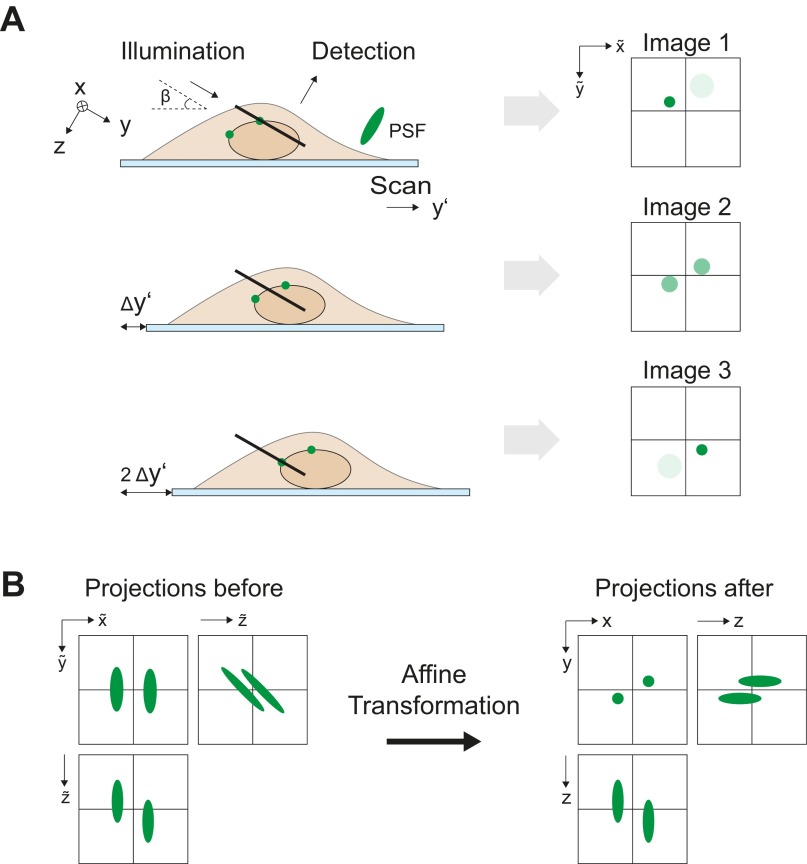
Fig. S2.

Fig. S2.

Representation of LS-RESOLFT images. (A) A sample with two fluorophores is scanned in the y′ direction through the static illumination LS, which makes an angle β with the horizontal plane. For clarity, the point-spread function (PSF) after off-switching is here depicted elongated along the z axis. Three steps of the scanning process are illustrated. The resulting images taken in the FOV of the camera (black line) are shown on the right. (B) The acquired image stack is affinely transformed to the coordinate system of the objective lenses using
(xyz)=(10001a001)(x˜y˜z˜),witha=Δypx,ysin60°.
Thus, the axial and lateral extent of the resultant PSF is directly visible in the resulting maximum intensity projections. Note that the affine transformation does not change the raw character of the LS-RESOLFT images. Note that, for better visualization, images have typically been represented with anisotropic pixels (pixel dimensions stated in figures). Versions with isotropic pixels can be found in Fig. S10.