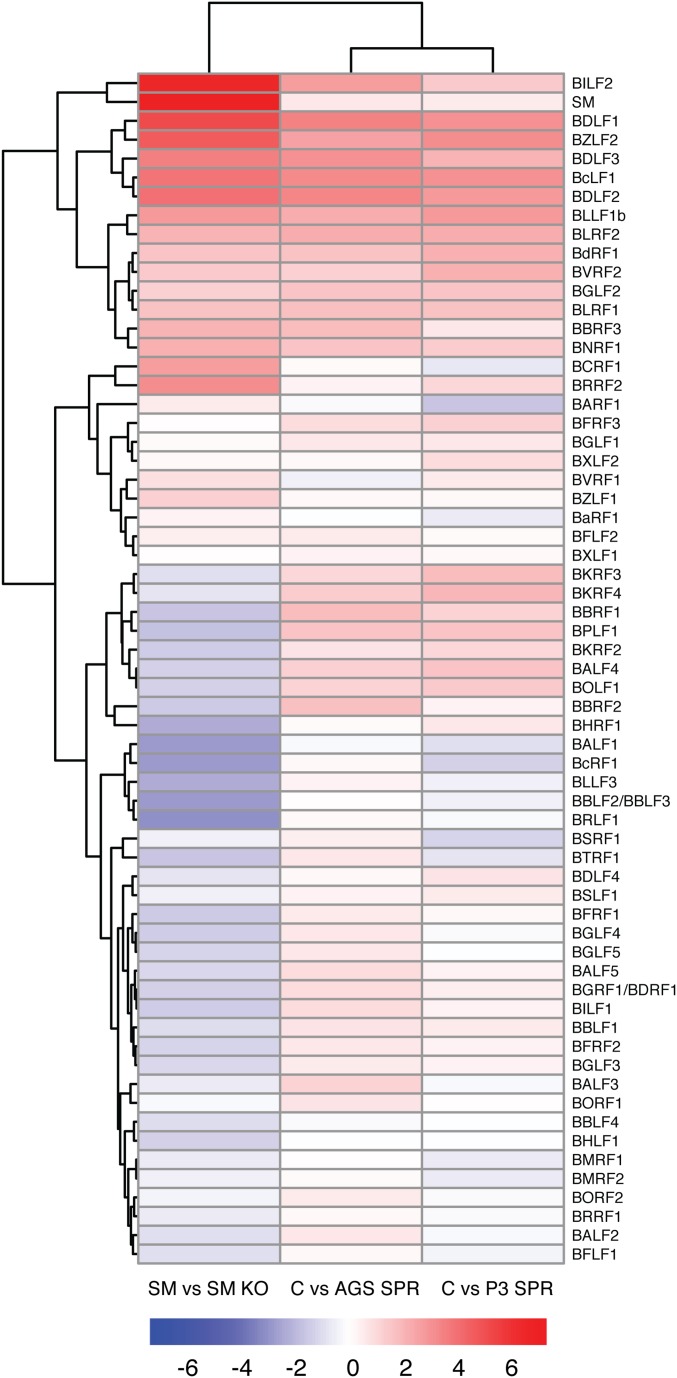
Fig. S8.
Clustering analysis of SM-dependent and SPR-sensitive genes. Differential expression of EBV lytic genes in the presence and absence of SM was compared with the effect of SPR in both epithelial (AGS) and B lymphocyte cells (P3). Differential expression between SM-expressing vs. SM KO cells, untreated (C) vs. SPR-treated AGS, and untreated (C) vs. SPR-treated P3HR1 cells, respectively, is shown as log2 fold changes. Red coloring indicates increased expression, and blue coloring indicates lower expression compared with SMKO or SPR-treated cells.

