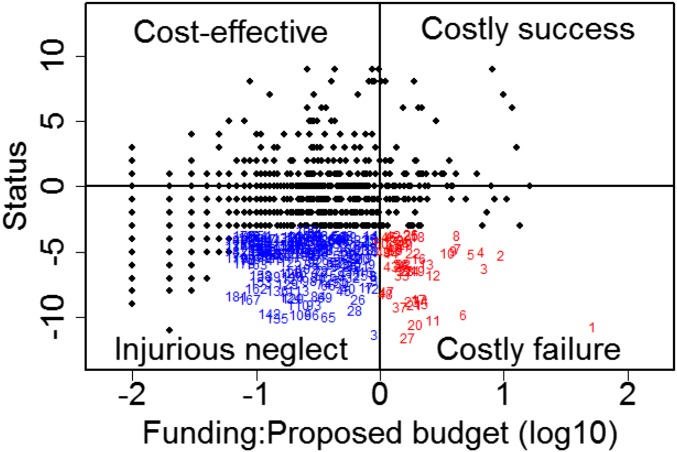
Fig. 2.
Framework for conservation triage. Shown is the index of recovery as a function of the proportion of the proposed budget actually allocated and spent on conservation for all species with conservation plans (black points). The index of recovery is the sum of years in which the population increases (+1), decreases (−1), or remains constant (0). Blue numbers represent species experiencing injurious neglect (SI Appendix, Table S1), and red numbers show species with recovery efforts that cost more than the budget proposed in their recovery plan (SI Appendix, Table S2). By increasing expenditures for injurious neglect species (blue numbers) and reducing expenditures for costly failure species (red numbers), recovery funding objectives are met for 182 species.

