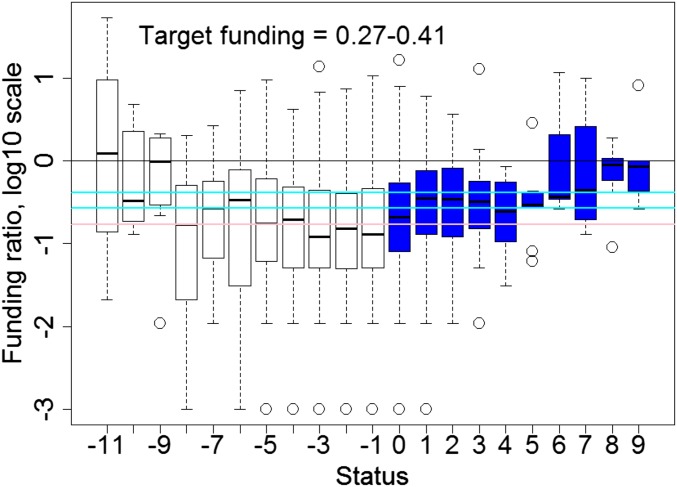
Fig. 4.
Realized funding (expressed as a proportion of proposed budget) as a function of recovery status. Species with a positive status are depicted by solid blue boxes and declining species are open boxes. The light-blue lines represent median funding levels of species with plans that are on average stable or increasing and plans that are on average increasing during a majority of years (0.27 and 0.41 of the proposed budget, respectively). The pink line represents the median funding level of all declining species plans (status −9 to −11) except those with funding levels >1.

