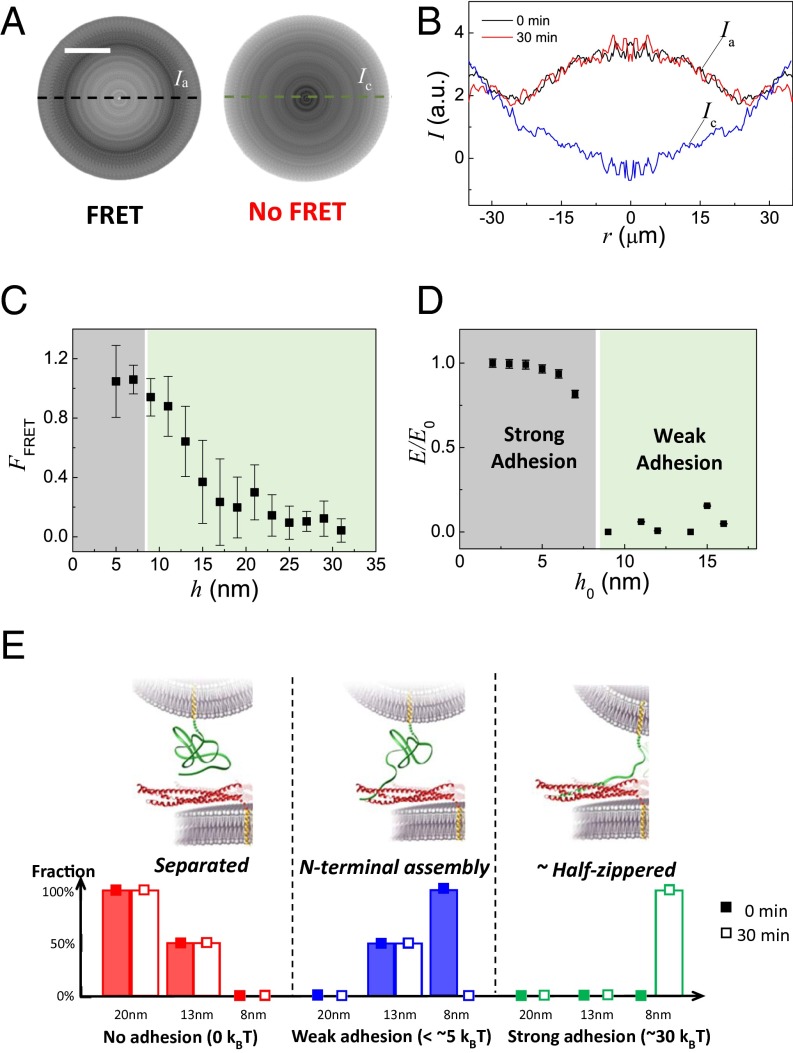
Fig. 4.
Stable N-terminal assembly is required for initial binding of the SNAREs. (A, Left) Spin-averaged picture (Materials and Methods and Fig. S3) of the FRET signal between two membranes decorated with fluorescently labeled t-SNARE and v-SNARE, respectively. (A, Right) Spin-averaged picture of the FRET signal in the control experiment. (Scale bar, 20 μm.) (B) Intensities taken along the dashed line through the center to form the intensity profiles are displayed: Ia (black and red lines) represents the intensity of the fluorescently labeled t-SNARE and v-SNARE experiments, whereas Ic (blue) is the control and r equals 0 at the center. The black line shows the intensity right after the contact, and the red line was obtained after the surfaces were kept in contact for 30 min. The two lines are overlapping, revealing no time dependence of the FRET signal. The variations in Ic are due to optical interferences. Hence, the actual FRET signal is the difference between Ia and Ic. (C) Fraction of the N-terminal assembly in the total population of SNARE pairs with the intermembrane separation distance h (obtained from r through Eq. 1). The N-terminal domains are only 100% assembled when h < 8 nm. The error bars are the SD, obtained by averaging 20–40 data points in four separate experiments. (D) Adhesion of t-SNARE– and v-SNARE–decorated membranes in the SFA with h0, the minimal intermembrane separation reached during the approach/separation cycle, is normalized by the strongest adhesion [same data as in the study by Li et al. (15)]. The membranes were kept at distance h0 for at least 20 min. (E) Various SNARE complex states in the SFA; their respective energies; and the distribution of these states after 0 and 30 min in contact at h = 8 nm, h = 13 nm, and h = 20 nm. Solid bars represent 0 min, and open bars represent 30 min.

