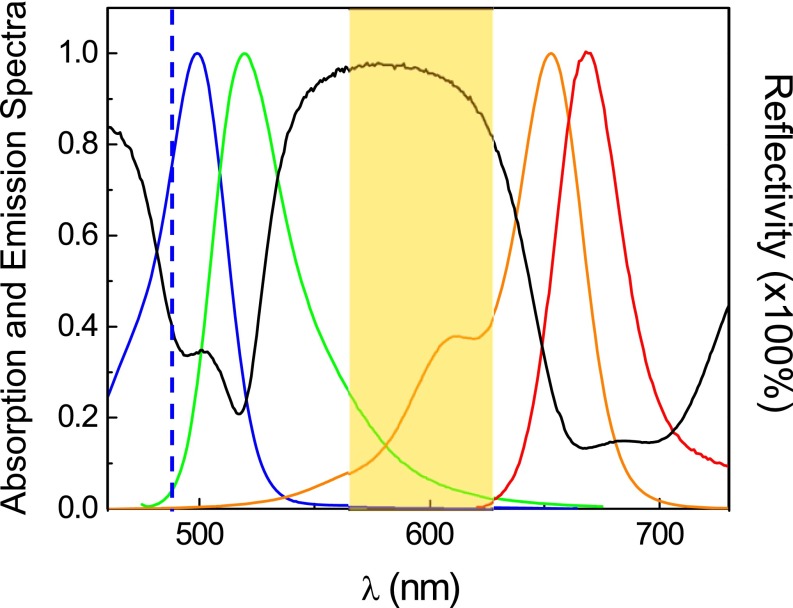
Fig. S1.
Reflectivity spectrum of the custom-designed coating of multi-dielectric layers, together with the absorption and emission spectra of two fluorophores, Alexa 488 and Alexa 647. The black curve is the reflectivity spectrum of the multi-dielectric layer Ti3O5/SiO2 coating; the blue and green curves are the excitation and emission spectra of Alexa 488 (donor), respectively; and the orange and red curves are the excitation and emission spectra of Alexa 647 (acceptor), respectively. The blue vertical dashed line indicates the wavelength of the 488-nm laser. The rectangular orange shadow on the plot indicates the wavelength range for the measurement of SFA FECOs.

