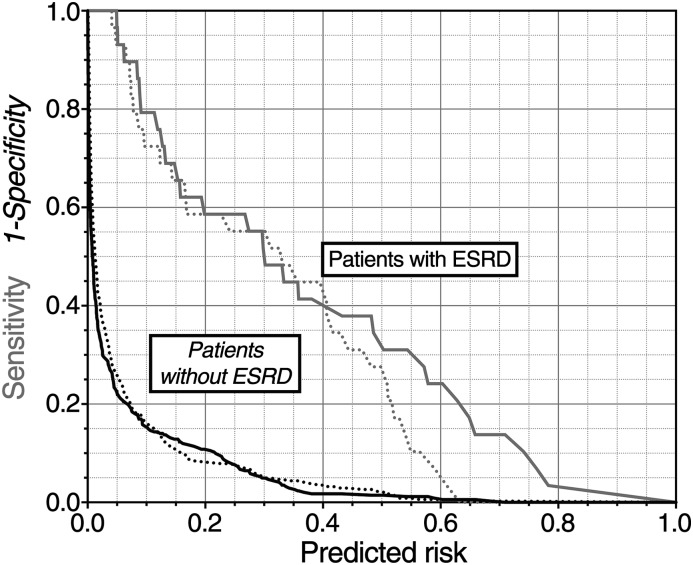
Figure 2.
Risk assessment plot illustrating added value of renal resistive index (RRI). Plotted is the calculated risk of ESRD against sensitivity (gray lines) and 1-specificity (black lines). The dotted lines are for the baseline model and the solid solid lines for the new model. Improvement of the new model over the old model is seen by separation between the dotted lines and the solid lines. For sensitivity (gray lines) this means the solid curve nearer the upper right-hand corner than the dashed curve. For 1-specificity (black lines) this means the solid curve nearer the lower left-hand corner than the dashed curve. The integrated sensitivity (IS) for each model is the area under the gray lines, the integrated 1-specificity (IP) is the area under the black lines.

