Figure 2.
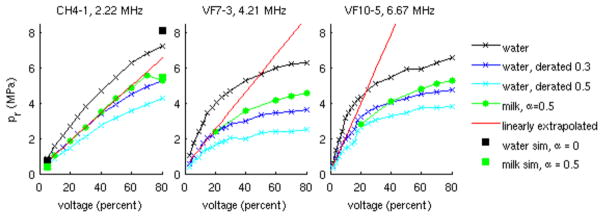
Peak rarefactional pressure (pr) values measured in water (x) and derated by: 0.3 dB cm−1 MHz−1 (x), and 0.5 dB cm−1 MHz−1 (x); pr derated water measurements linearly extrapolated from small signal values ((−), see appendix A); pr estimated using a grid of source pressure measurements in water and modeling nonlinear propagation using the 3D KZK model with numerical solution methods described previously44 (CH4-1 only) assuming propagation through water (■) and milk (■); as well as in situ pr measurements made in an evaporated milk solution ((●), measured attenuation = 0.5 dB cm−1 MHz−1). Note that derating water values by 0.3 dB cm−1 MHz−1 provides reasonable agreement with the milk measurements (to within 20% for all transducers); however, derating water values by the actual measured attenuation of the milk (0.5 dB cm−1 MHz−1) leads to considerable underestimation of the milk measurements. Additionally, the linear extrapolation approach considerably overestimates the milk measurements for the higher frequency transducers, whereas the source pressure + nonlinear simulation approach (black squares and green squares, left plot) is in good agreement with the milk measurements. Each array transducer was focused with an F/2 lateral focal configuration concurrent with its fixed elevation focus.

