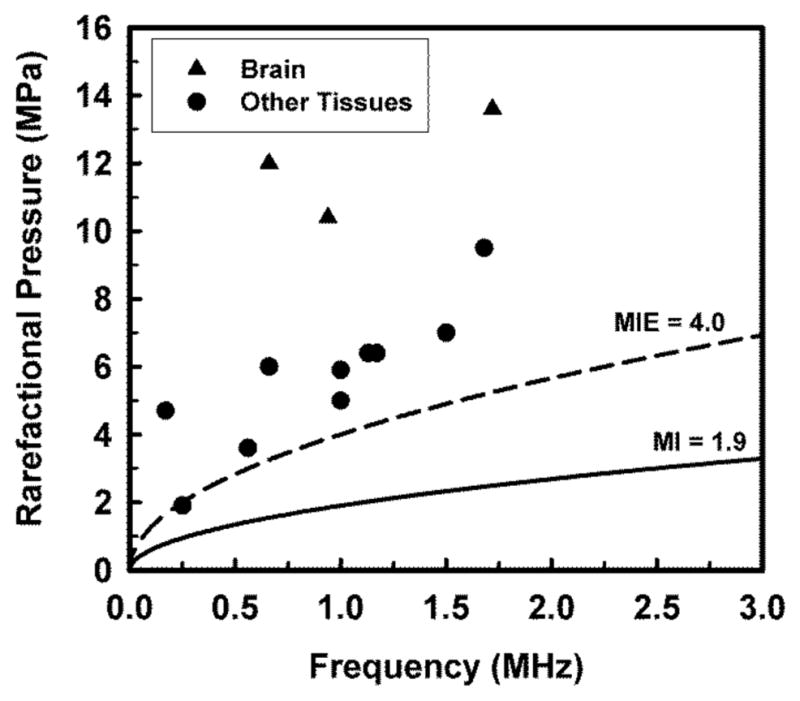
Figure 3.

Best estimates of in situ rarefactional pressure shown in Table 1. Triangles and circles indicate values for brain and all other tissues, respectively. Curves delineate pressures calculated for the maximum value of the MI in the FDA’s guidance for track 3 devices (solid curve, labeled MI = 1.9) and an effective mechanical index of 4.0 (dashed curve, labeled MIE = 4.0).
