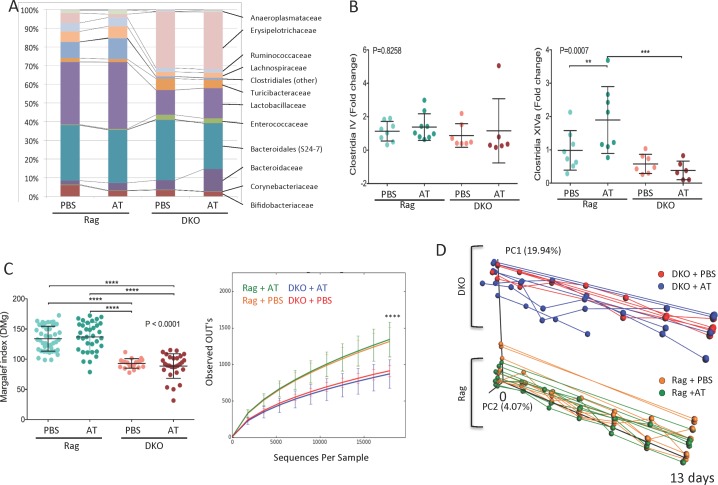
Fig 4. Changes in microbiota composition in Rag and DKO mice before and after adoptive T cell transfer.
(A) Endpoint taxonomic analysis (day 13) of the relative abundance of bacterial families in fecal samples; (B) Endpoint qPCR analysis of selected clusters of Clostridia; (C) Endpoint analysis of alpha diversity (Margalef index and the number of observed OTUs); (D) Principal Coordinate Analysis (PCoA) of unweighted UniFrac distances between of microbiota samples (first two principal coordinate axes versus time shown) in Rag2-/- and DKO mice with or without adoptive T cell transfer over the course of the experiment. Samples were collected every 2 days post injection. Prematurely ended lines (DKO+AT) represent mice sacrificed earlier due to a critical body weight loss (≥20%). Points represent individual mice. In B-C, statistical analyses were performed using one-way ANOVA (P value indicated in each panel) with Fisher’s LSD post-hoc test. Asterisks in all panels indicate statistical significance: * P < 0.05, ** P < 0.01, *** P< 0.001, **** P < 0.0001.

