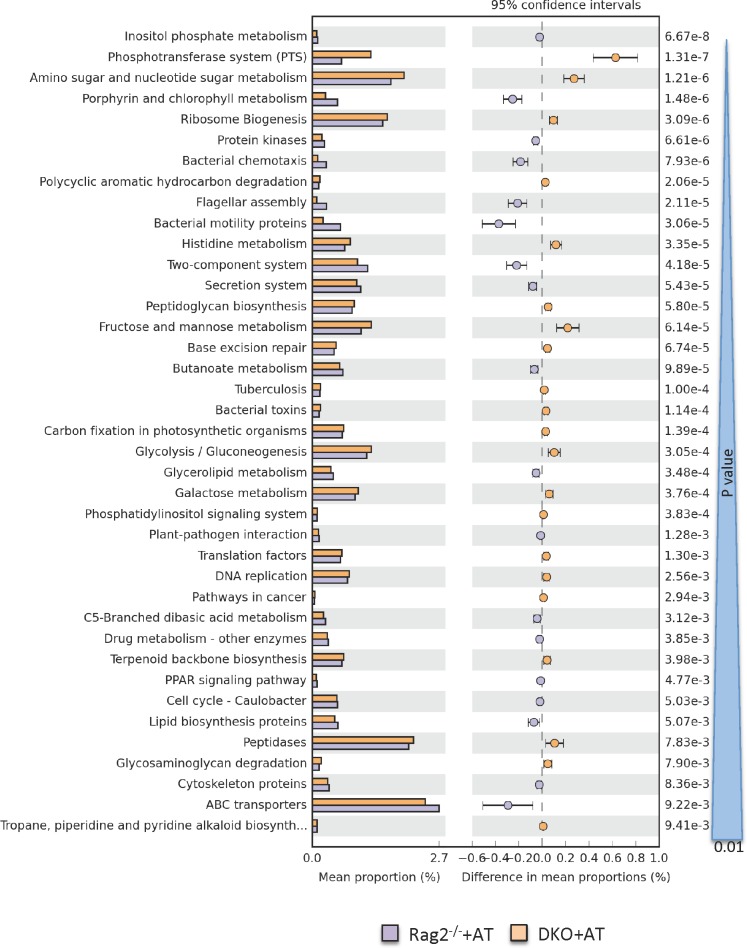
Fig 6. PICRUSt prediction of functional profiling of the microbial communities based on the 16S rRNA gene sequences.
Extended error bar plot indicating differences in functional profiles of the Rag+AT and DKO+AT microbiota (at taxonomic Level 3). All unclassified reads were removed and categories with minimum of 20 reads, and P value greater than 0.01 is displayed. Categories are sorted by P value calculated using two-sided Welch’s t-test.

