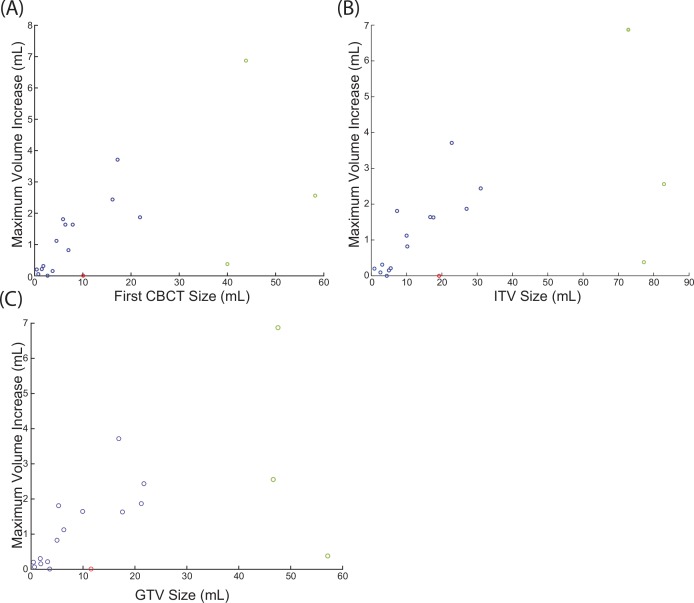
Fig 6. Linear regression between the FCV and maximum inter-fraction volume.
Points in green were excluded from the linear regression due to their large volumes relative to the other points, but are included in the correlation analysis. Data point in red was excluded because the patient’s treatment was re-planned.

