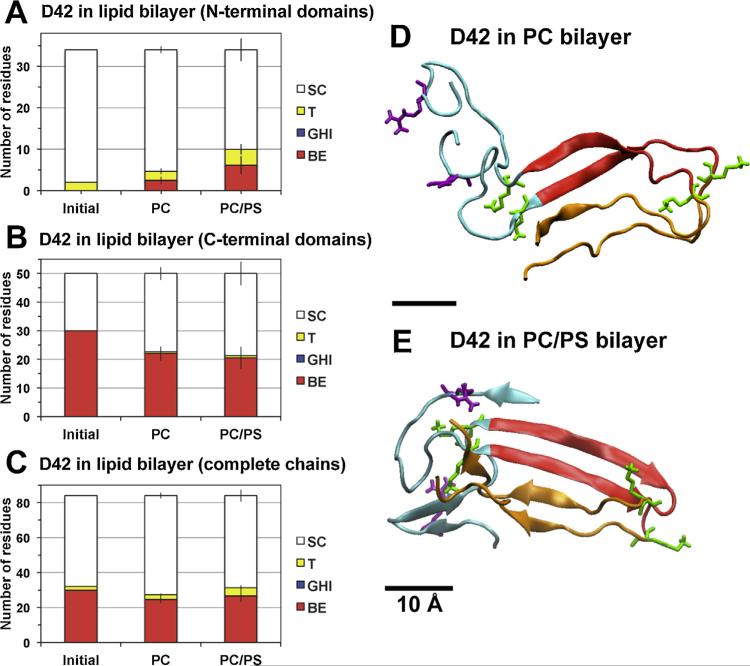
Fig. 4. Average secondary structure of protein in protein/lipid bilayer systems.
(For interpretation of the references to color in this figure legend, the reader is referred to the web version of this article.)
The average numbers of residues involved in reduced secondary structures (SC, T, GHI and BE) calculated from DSSP (see Section 2) for D42 in PC and PC/PS lipid bilayers in the N-terminal domains (A), C-terminal domains (B) and complete chains (C) are shown. The structural calculations were averaged over the last 50 ns of the simulation of each simulation replicate. The average was then across all four independent replicates of each lipid bilayer system with means and standard errors (bars) as given. For comparison, the initial (0 ns) reduced secondary structures of D42 are also presented. Protein conformations of representative replicates of D42 in PC (D) and PC/PS (E) bilayers at 200 and 350 ns simulation times, respectively, are illustrated. The N-terminal domain (residues 1–17 in blue ribbon) and C-terminal domain (residues 18–28 in red and residues 29–42 in orange) of each chain are shown. The six positively charged residues (lysine in green and arginine in purple) are in thick licorice lines. A scale bar of 10 Å is shown.

