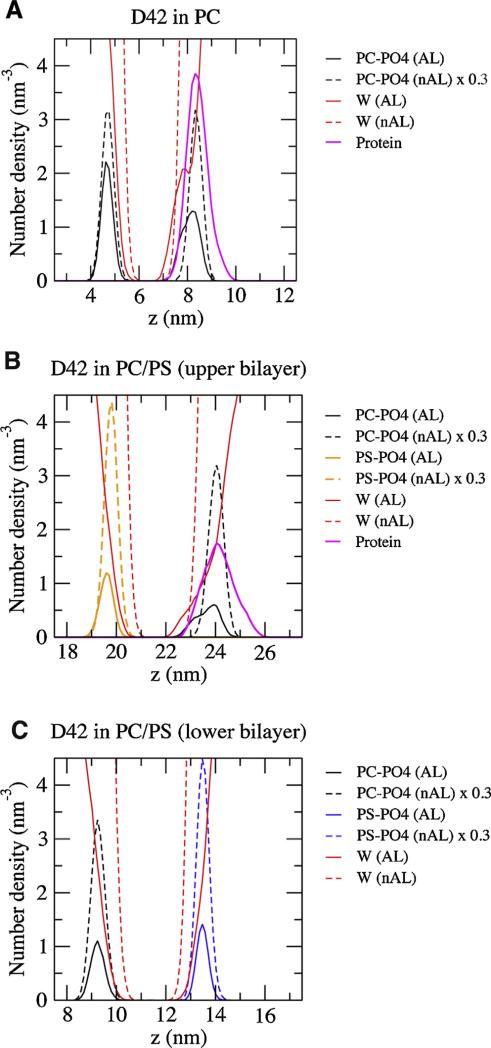
Fig. 8. Average transbilayer density profile in protein/lipid bilayer systems.
(For interpretation of the references to color in this figure legend, the reader is referred to the web version of this article.)
Average number density of groups of molecules versus z-axis (normal of the bilayer) of the complexes containing the single PC bilayer (A), PC/PS upper bilayer (B), and PC/PS lower bilayer are shown. The average was over the last 50 ns of each simulation replicate and across all four repeating replicates of each replicate. The results for the upper PC/PS bilayer in which D42 was attached are shown. The non-annular (nAL) and annular (AL) lipid and water groups are in dashed and solid lines, respectively. The groups represent the phosphate of PC (PC–PO4) in black, the phosphate of PS (PS–PO4) in orange, the water (W) in red, and the protein in thick pink. The number densities of the lipids in the nAL region are scaled by a factor of 0.3 to facilitate the comparison of the density peak locations. The method of separation into AL and nAL regions has been described in Section 2.

