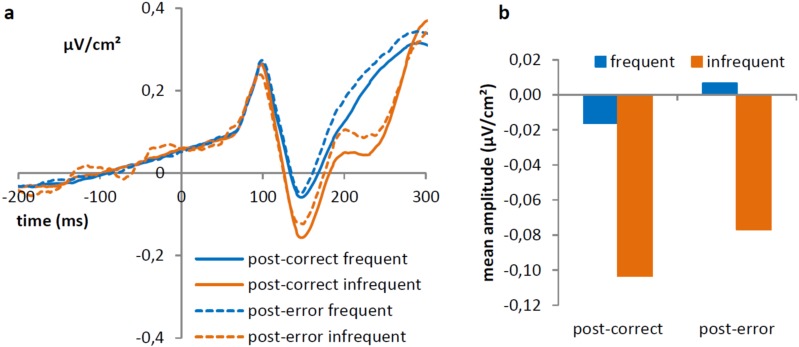
Fig 3.
Left side of the figure (a) shows the Laplacian transformed grand average ERP waveforms at PO7 and PO8 showing the P1 (measured between 80 and 130 ms) and N1 (measured between 130 and 180 ms) as a function of previous accuracy in the flanker task and frequency. On the right side (b) average amplitude (in μV/cm2) of the N1, for frequent and infrequent stimuli following correct and erroneous trials in the flanker task are shown.

