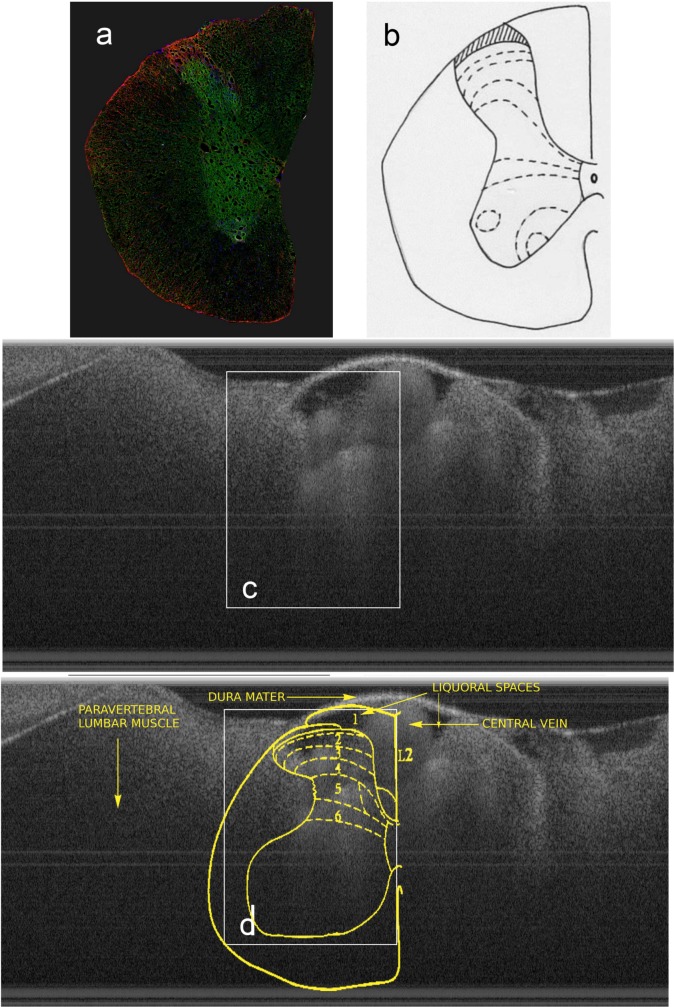
Fig 1.
a) confocal image of a coronal hemisection of the spinal cord, with Glial Fibrillary Acidic Protein (GFAP, red), neurofilaments (green) distributed in the cytoplasm, and nuclei (blue); b) vignette to guide the eye, dotted lines delimiting the laminae; c) in-vivo cross sectional OCT image of the whole cord; d) laminar labelling superimposed over the OCT image in c). L2 means second lumbar myelomer and numbers from 1 to 6 refer to sensory laminae of the dorsal horn.

