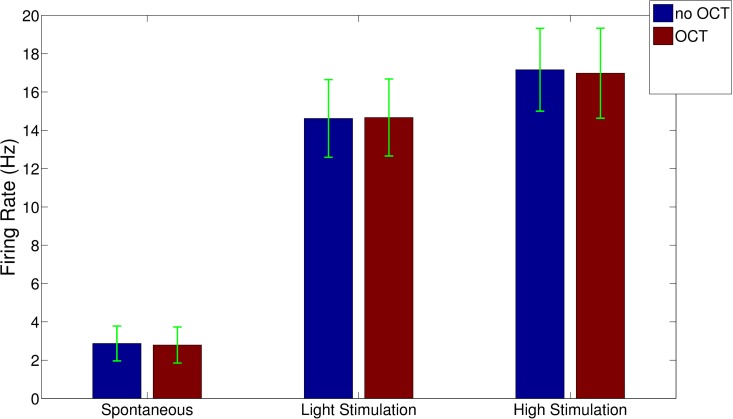
Fig 2. The mean spontaneous (left side) light (center) and high mechanical (right) threshold stimulus evoked mean neuronal activities.
Blue bars: with inactive OCT probing. Brick-red bars: same as above in the presence of OCT scanning. Statistical tests (Wilcoxon non-parametric ranksum test) reported no significance between normal recordings and those performed in conjunction with OCT scanning [p = 0.564 (spontaneous), p = 0.890 (light stimulation), p = 0.711 (high stimulation)].

