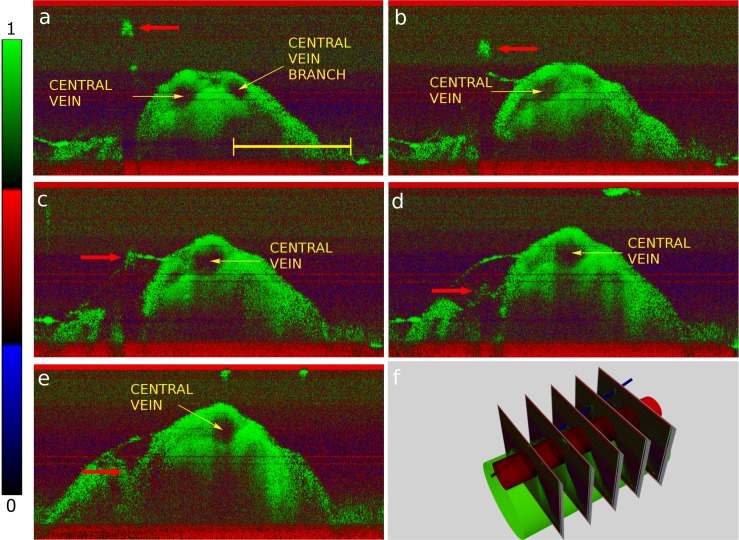
Fig 3.
: a), b), c), d), e): OCT sequence of images showing the trace of a needle probe being inserted in the spinal cord (arrow), and f): mutual relation between the OCT images, cord, dorsal vein and needle (not to scale). In a), the OCT probe was aligned orthogonally to the tip of the microelectrode that progressively meet the axis of the central vein. The color bar indicates the color distribution over the normalized dynamic range. The scale bar is 3 mm long.

