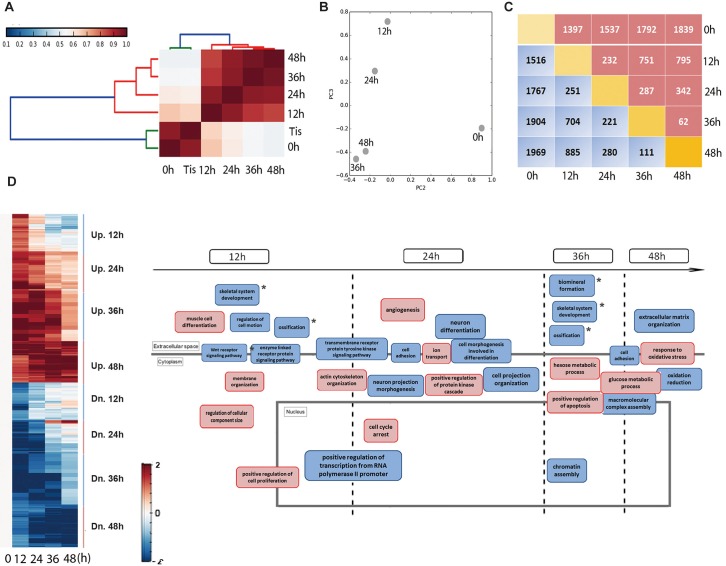
Fig 3. Global transcriptome profiles of mDMCs.
(A) Hierarchical clustering analysis of dental mesenchymal tissue or cell samples. Tis, dental mesenchymal tissues. (B) Principal components analysis (PCA) showed the distances between various cell populations. Variation between two adjacent cell populations was reduced with time. (C) The number of differentially expressed genes between every two cell populations was listed. The red bracket indicates the number of upregulated genes and the blue indicates the downregulated genes. (D) Differentially expressed genes were divided into eight clusters according to their temporal patterns. Functional annotation analysis of genes in each cluster was performed, and the biological processes were reconstructed. The red bracket indicates processes involving the upregulated genes in the given time interval and the blue bracket indicates those involving the downregulated genes. * indicated the biological processes associated with tooth development.

