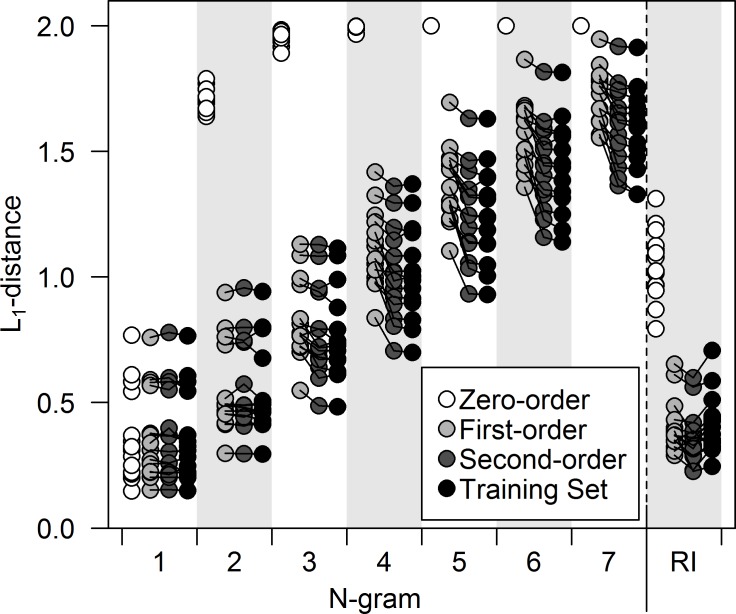
Fig 2. L1-distances for the three candidate models compared with those of the training set.
Lines connect results from a given individual for the first-order, second-order, and training results, but were not drawn from the zero-order model for clarity and because this model so clearly diverged from the rest. Values on the left represent the seven N-gram distributions, while the values on the right represent the recurrence interval (RI) distributions.

