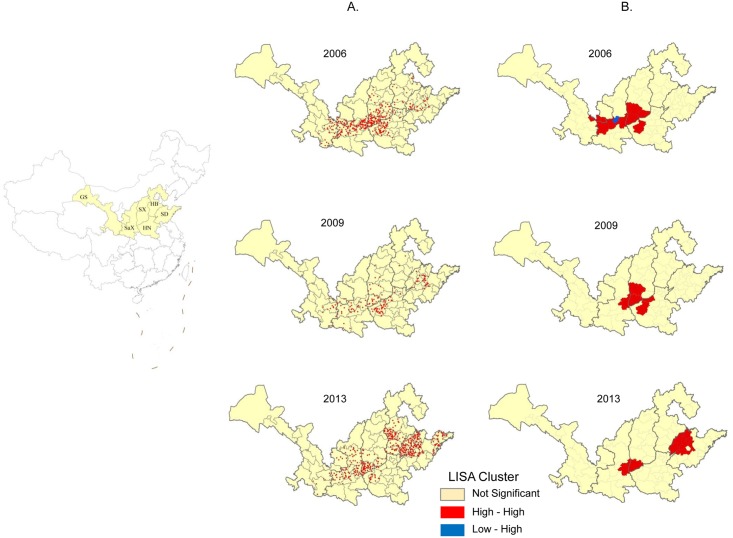
Fig 8. Clusters of adult JE cases in the six northern provinces during the three epidemic waves.
(A) Distribution of adult JE cases; (B) LISA cluster map showing the types of clusters in color. High-High means regions with high rates are surrounded by neighbors with high rates and indicates a significant (P < 0.05) spatial cluster of high JE incidence. Low-Low represents a spatial cluster of low JE incidence values. Low-High means regions with low rates are surrounded by higher rates.

