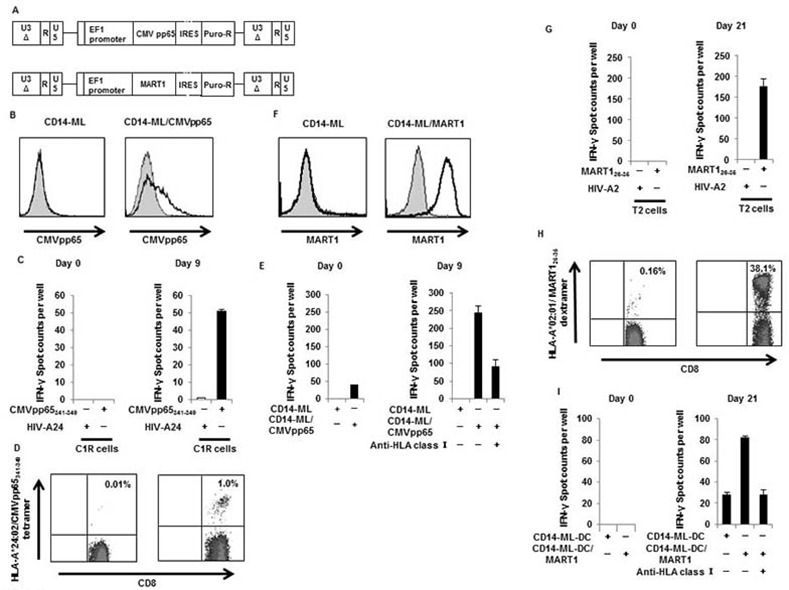
Fig 8. Induction of CD8+ T cell lines that are reactive to antigens by CD14-ML-DC that express antigenic proteins.

(A) The lentivirus constructs for CMVpp65 (EF-CMV-IP) and MART1 (EF-MART1-IP) are shown. CD14-ML were transduced with the lentivirus vector and cultured in the presence of puromycin (5 μg/ml) to select and expand the cell population carrying the transgene, resulting in the generation of CD14-ML/CMV and CD14-ML/MART1. (B) Expression of CMVpp65 by CD14-ML/CMV was analyzed by flow cytometric analysis. The staining profiles of the specific mAb (black lines) and isotype-matched control mAb (gray area) are shown. (C) CD14-ML-DC/CMV derived from a HLA-A*24:02-positive healthy donor were cultured with autologous CD8+ T cells. On day 9, the number of T cells reactive to the CMVpp65341-349 peptide was analyzed by ELISPOT assay. The HIV-peptide was used as a control peptide. The results of the T cells before stimulation culture are shown (Day 0). (D) On day 9, the T cells were recovered and stained with an anti-CD8 mAb and a tetramer of HLA-A*24:02/CMVpp65341-349 complex. The numbers in the figure indicate the percentage of the CD8+ T cells positively stained with the tetramer of the HLA-peptide complex. The results of the T cells before stimulation culture are also shown (Day 0). (E) CD8+ T cells obtained from an HLA-A*24:02-negative healthy donor were co-cultured with autologous CD14-ML-DC/CMV. On day 9, the number of IFN-γ producing CD8+ T cells was analyzed by ELISPOT assay, using CD14-ML and CD14-ML/CMV as stimulators. The results of the T cells before stimulation culture are also shown (Day 0). (F) Expression of MART1 by CD14-ML/MART1 was analyzed by flow cytometric analysis. The staining profiles of the specific mAbs (black lines) and isotype-matched control mAbs (gray area) are shown. (G) CD8+ T cells obtained from an HLA-A*02:01-positive healthy donor were co-cultured with autologous CD14-ML-DC/MART1 cells. On day 21, the frequency of CD8+ T cells reactive to MART126-35 was analyzed by ELISPOT assay. The HIV-peptide was used as a control peptide. The results of the T cells before stimulation culture are also shown (Day 0). (H) On day 21, the T cells were recovered and stained with an anti-CD8 mAb and HLA-A*02:01/MART126-35 dextramer. The numbers in the figure indicate the percentage of the CD8+ T cells that were positively stained with the dextramer of the HLA-peptide complex. The results of the T cells before stimulation culture are also shown (Day 0). (I) CD8+ T cells obtained from an HLA-A*02:01-negative healthy donor were co-cultured with autologous CD14-ML-DC/MART1. On day 21, the frequency of CD8+ T cells reactive to MART1 was analyzed by ELISPOT assay, using CD14-ML-DC and CD14-ML-DC/MART1 as stimulators. The results of the T cells before stimulation culture are also shown (Day 0).
