Fig 4.
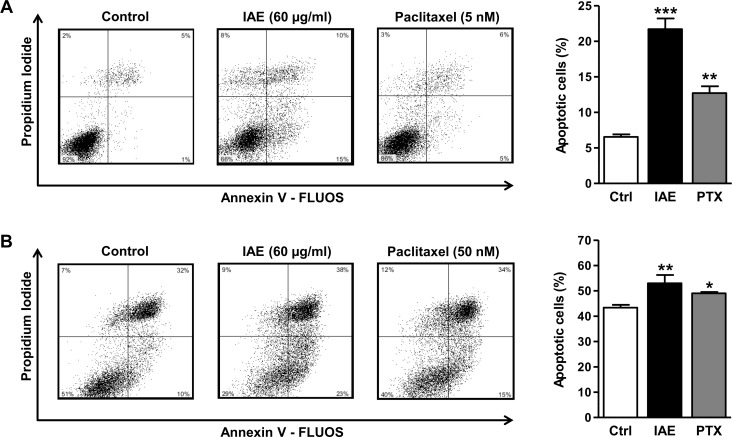
Annexin V assays of HT-29 (A) and T84 (B) colon carcinoma cells after treatment with IAE for 48 h. Apoptosis was determined by flow cytometry of annexin V-FLUOS and propidium iodide stained cells. Scatter plots show one representative experiment for each treatment condition. Bar plots indicate the percentage of apoptotic cells, comprising early (annexin positive, PI negative) and late stage (annexin positive, PI positive) events. Bars represent mean ± SEM (n = 3). *p≤0.05, **p≤0.01, ***p≤0.001 vs. control.

