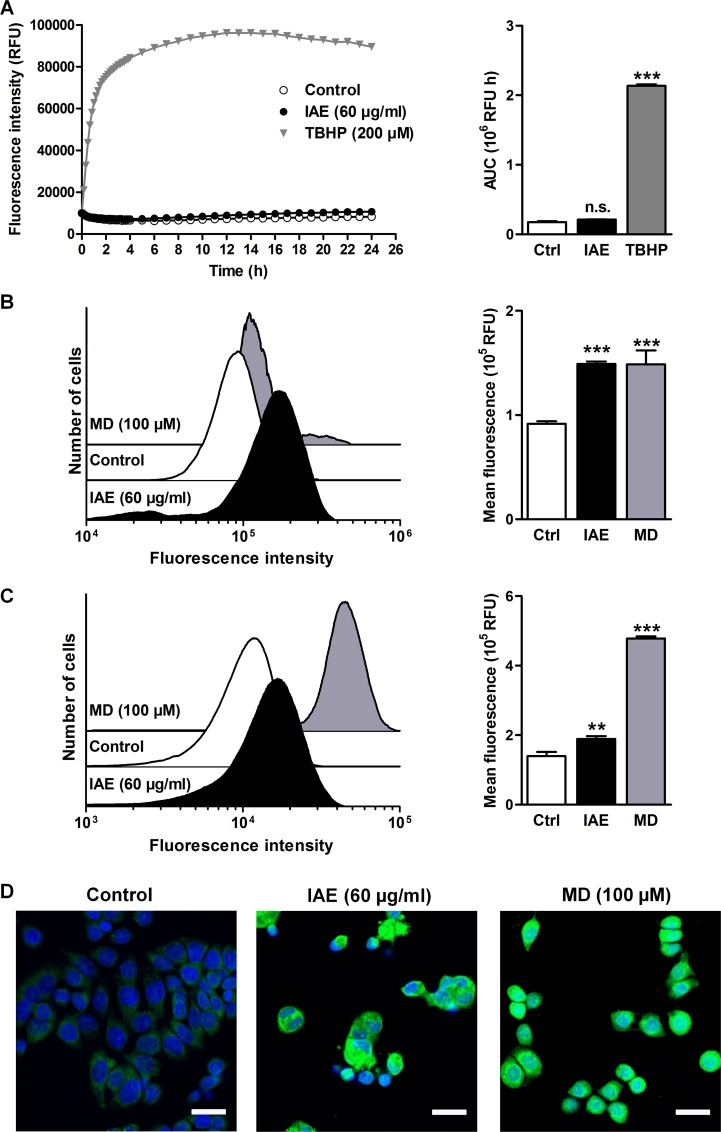
Fig 5. Extra- and intracellular formation of reactive oxygen species (ROS) and of lipid peroxides in HT-29 cells after treatment with IAE.
A, Extracellular formation of ROS in full cell culture medium was kinetically detected using the ROS-sensitive CellROX Orange fluorogenic probe. Data are expressed as mean ± SEM (n = 8). B, Intracellular ROS was detected by flow cytometry of HT-29 cells stained with CellROX Orange after treatment for 24 h. Histograms (left) show one representative experiment for each treatment condition. Bar plots (right) show fluorescence intensities as mean ± SEM (n = 6). C, Intracellular lipid peroxidation was detected by flow cytometry of cells treated for 24 h using the Click-iT technology. Increasing fluorescence intensities are a result of enhanced lipid peroxidation upon treatment. Histograms (left) show one representative experiment for each treatment condition. Bar plots (right) show fluorescence intensities as mean ± SEM (n = 6). D, Intracellular lipid peroxidation was visualized by fluorescence microscopy (green, lipid peroxides; blue, nucleus). Scale bars, 25 μm. n.s. not significant, **p≤0.01, ***p≤0.001 vs. control.

