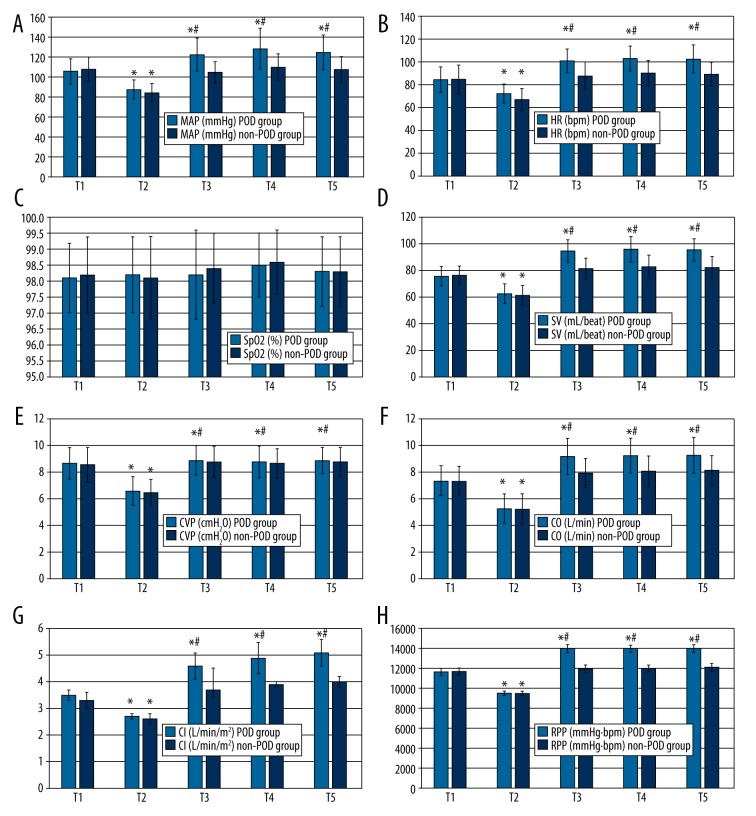
Figure 1.
MAP (A), HR (B), SpO2 (C), SV (D), CVP (E), CO (F), CI (G), and RPP (H) in patients in the POD and non-POD groups. Data are expressed as the mean ± standard error of the mean. n=137 for the POD group. n=343 for the non-POD group. * P<0.05 cf. T1; # P<0.05 cf. non-POD group. T1, 10 min before the initiation of anesthesia (baseline); T2, 10 min after the initiation of anesthesia; T3, 30 min after the initiation of anesthesia; T4, 60 min after the initiation of anesthesia; T5, conclusion of surgery.

