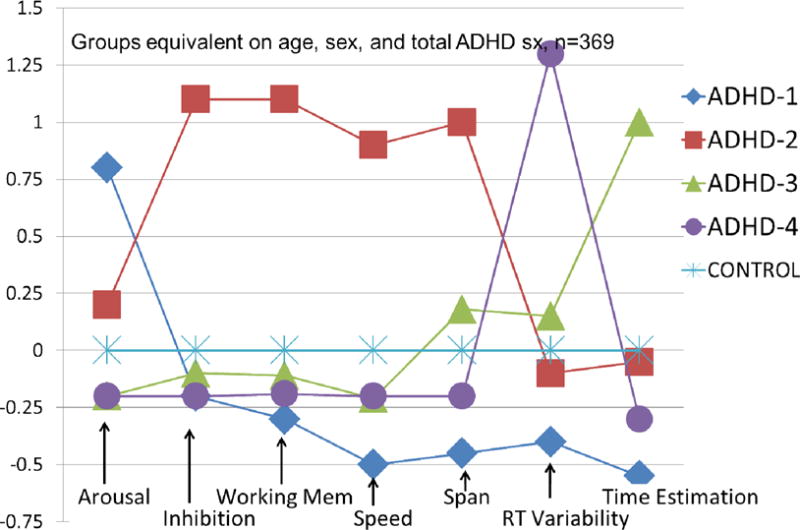
Figure 2.

Profiles of four ADHD subgroups identified by mathematical community detection analysis. Profiles were observed in both ADHD and typically developing control children but are scaled here against the control group mean (set at zero) to convey the performance variation in the ADHD group. From Fair et al. (2012) discussed in the text
