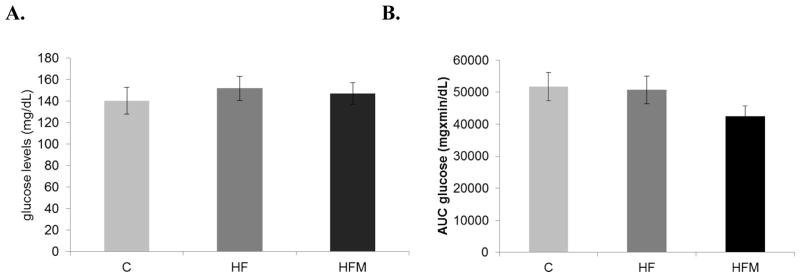
Figure 2. Effect of high fat diet and metformin on fasting glucose levels and glucose tolerance.
(A)Fasting blood glucose levels were measured as part of the oral glucose tolerance test, after 5 months of dietary treatment. (B) Blood glucose levels at various time points after an oral dose of 2g/kg(body weight) of glucose by gavage. * Significantly different from corresponding time point of C and HF groups, p=0.025. Error bar = ± standard error of mean. (C) Analysis of area under the curve showed no significant differences between groups p=0.225 (n= 6, 7 and 7 for C, HF and HFM groups respectively).

