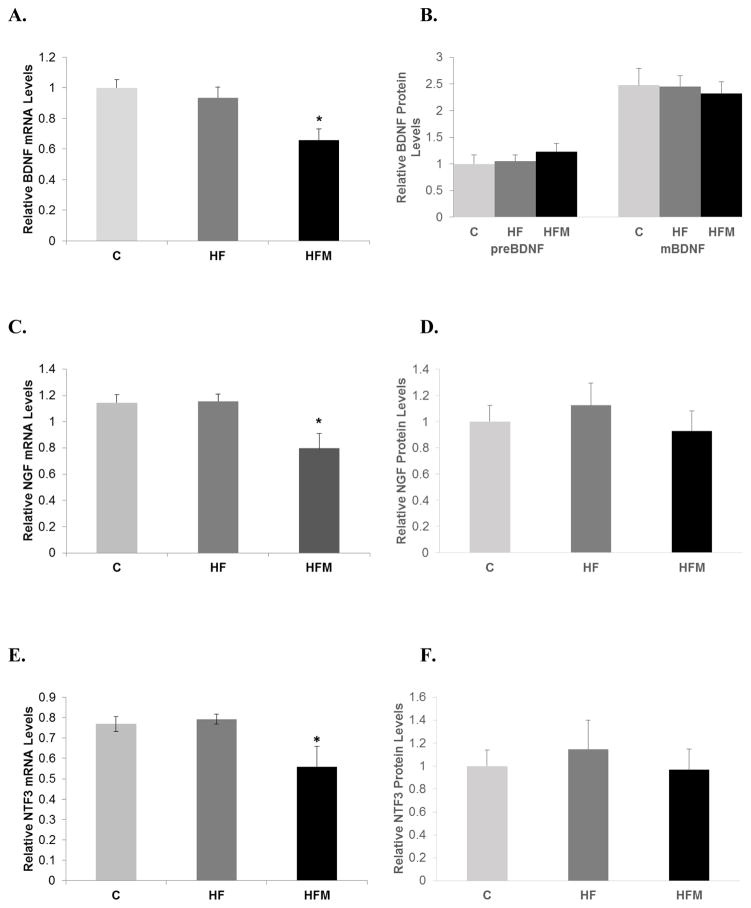
Figure 5. Effect of high fat diet and metformin treatment on neurotrophic factor expression in brain.
(A) BDNF mRNA levels. (B) Protein levels of preBDNF and mature BDNF. (C) NGF mRNA levels (D) NGF protein levels, (E) NTF3 mRNA levels. (F) NTF3 Protein levels. * = significantly different from C and HF, p < 0.001. All mRNA levels were normalized to GAPDH and protein levels were normalized to β-actin protein or ponsceau S. Error bar = ± standard error of mean.

