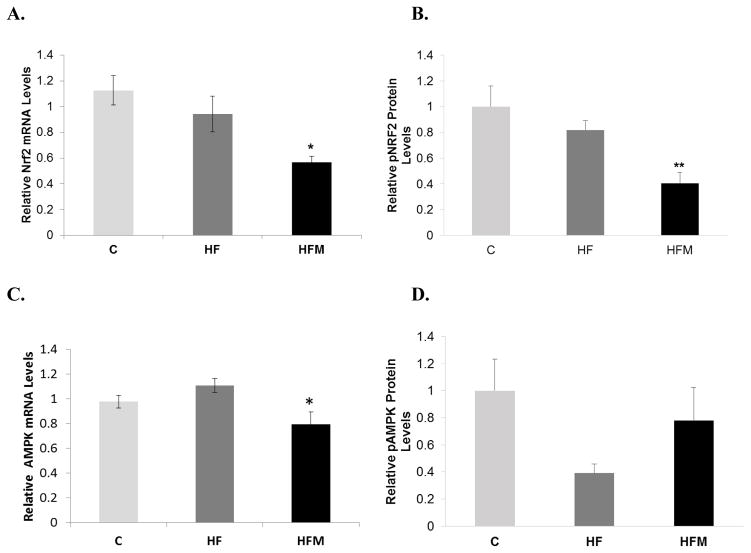
Figure 6. Effect of metformin treatment on Nrf2 and AMPK expression.
(A) Nrf2 mRNA levels. (n=9,10,7 for C, HF and HFM respectively). (B) Protein levels of pNrf2 relative to total Nrf2 protein (n= 8,12,6 for C, HF and HFM respectively) ** = significantly different from C (p=0.007) and HF (p=0.049). (C) AMPK mRNA levels (n=14,13,7 for C, HF and HFM respectively); * = significantly different from C and HF (p=0.01). (D) Protein levels of pAMPK relative to total AMPK protein (n=9,9,10 for C, HF and HFM respectively). P=0.068. Error bar = ± standard error of mean.

