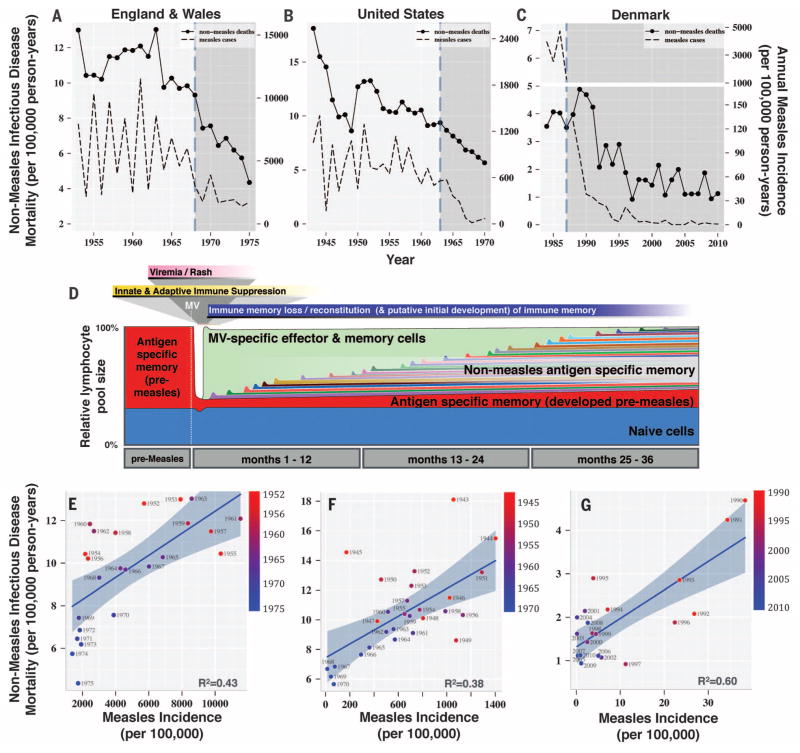
Fig. 1. Measles incidence, nonmeasles infectious disease mortality, and measles-induced immunomodulation.
Nonmeasles infectious disease mortality and measles incidence time series (A to C) and regressions (E to G) are shown for England and Wales, the United States, and Denmark. The vertical dashed lines in (A) to (C) indicate the year of introduction of the measles vaccine. (D) Measles-induced lymphopenia and subsequent measles-specific lymphocyte expansion in the weeks after MV infection, as described in (17, 23), are shown, and time is extended to depict hypothesized long-term immunomodulatory effects of MV infection and reconstitution of the immune response through individual exposures. Scatter plots and best-fit regression curves (plotted with 95% confidence bands) are shown for nonmeasles infectious disease mortality versus measles incidence for England and Wales (E), the United States (F), and Denmark (G).

